CPI inflation rises for a fourth consecutive month
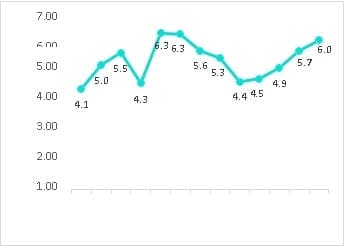
Retail inflation, as measured by the consumer price index (CPI), jumped to a seven-month high of 6.01% in January’22. A relatively lower base from a year ago and a spike in food and clothing inflation has driven consumer inflation beyond the upper band of RBI’s target range (2-6%). The higher inflation print is broadly in line with CareEdge’s estimate of 6.1%.
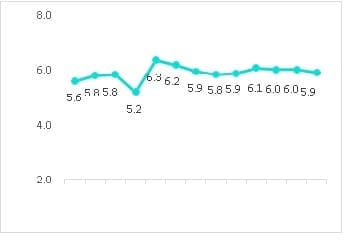
Core inflation (which excludes volatile components such as food and energy prices) was one basis point lower but elevated at 5.9% in January’22 compared with 6% in December’21. Barring April’21, core inflation has remained sticky around 6% during the current fiscal year so far. Various reasons like high oil prices, supply chain disruption, input cost pressures have contributed to build-up of price pressures in the economy thereby leading to sticky core inflation.
Exhibit 1: Retail price inflation (YoY%)
Exhibit 2: Core CPI (YoY%) 

Narrowing divergence between rural and urban inflation
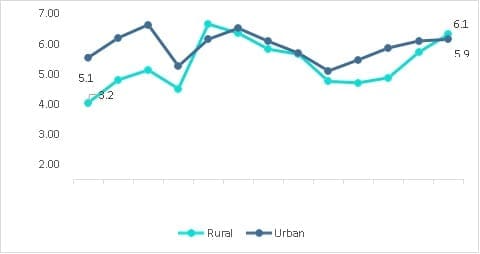
Regionally, rural and urban inflation have been inching upwards since September’21 with urban inflation outpacing the inflation in rural counterparts. In January’22, however, the trend was reversed with rural inflation (6.1%) surpassing urban inflation (5.9%).
During the month, inflation in urban areas accelerated to a 7-month high, while rural inflation was pegged at the highest level since July’21. The strengthening price pressures in both urban as well as rural areas is in line with the all-India level. However, with rural inflation picking up pace in recent months, the gap between the two has been narrowing. Re-imposition of curbs and mobility restrictions owing to the third wave of Covid could have led to higher transaction and distribution costs resulting in spike in inflation number for both the regions.
Exhibit 3: Rural vs Urban CPI

Component-wise inflation analysis
- Food and beverages component, with nearly 46% weightage in CPI, witnessed a spike in inflation at 5.6% (Y-o-Y) in January’22. Adverse base effect coupled with soaring vegetable and edible oils prices has pushed the food index higher during the month.
- Vegetable prices grew by 5.2% in January’22 after remaining in deflationary territory for the 13 months in a row. The rate of inflation was still much lower compared to the double-digit vegetable inflation witnessed at wholesale level (38.5% in January’22). A part of the reason for the unprecedented rise in vegetable prices is supply disruptions caused by excess rainfall in the southern parts of the country. Additionally, rising fuel prices increased the transportation costs for farmers, pushing prices of perishable items to a higher level.
- Edible oils inflation, despite some easing, was elevated at 18.8% in January’22 largely catalysed by supply-side constraints. Reduction in export availabilities combined with unfavourable weather and rising crude oil prices triggered an unprecedented rise in vegetable oil prices. On a sequential basis, edible oils price declined by 1.6% owing to positive interventions by way of import duty cuts and imposition of stock
- Clothing and footwear strengthened to 8% in January from 8.3% in the previous month. Though the GST Council deferred the GST rate hike for textiles, the clothing inflation has been inching upwards due to an increase in raw materials and freight costs. The GST hike on footwear effective from January 2022, is expected to further push up prices in this category.
- Housing inflation stood at 3.5% in January’22 compared with 3.6% in the previous month. The inflation in this category has been range bound between 5 – 3.9% during the current fiscal.
- Fuel and light inflation receded to single digit print at 3% after a gap of 8 months. The high inflation in this segment is partly due to the soaring global fuel prices amid geopolitical tensions. However, November’21 onwards, a slight moderation has been observed in fuel inflation owing to a cut in fuel excise duty by the union government.
- Inflation in the miscellaneous component was almost steady at 6.5% in January’22 compared with 6.6% in the previous month. The main drives were transport and communication (9.4%), recreation (7%), health (6.9%) and household goods and services (7.2%).
Table 1: Component wise retail inflation (YoY%)
| Food and Beverages | Pan, tobacco and intoxicants | Clothing & footwear |
Housing |
Fuel & light |
Miscellaneous |
|
| Weight | 45.86 | 2.38 | 6.53 | 10.07 | 6.84 | 28.32 |
| Jan-21 | 2.7 | 10.9 | 3.8 | 3.3 | 3.9 | 6.5 |
| Feb-21 | 4.3 | 10.7 | 4.2 | 3.2 | 3.5 | 6.8 |
| Mar-21 | 5.2 | 9.9 | 4.4 | 3.5 | 4.4 | 7.0 |
| Apr-21 | 2.7 | 9.0 | 3.5 | 3.7 | 7.9 | 6.2 |
| May-21 | 5.2 | 10.0 | 5.3 | 3.9 | 11.6 | 7.5 |
| Jun-21 | 5.6 | 4.0 | 6.2 | 3.8 | 12.7 | 7.3 |
| Jul-21 | 4.5 | 4.7 | 6.5 | 3.9 | 12.4 | 6.7 |
| Aug-21 | 3.8 | 4.0 | 6.8 | 3.9 | 12.9 | 6.4 |
| Sep-21 | 1.6 | 4.2 | 7.2 | 3.6 | 13.6 | 6.4 |
| Oct-21 | 1.8 | 4.3 | 7.5 | 3.5 | 14.4 | 6.8 |
| Nov-21 | 2.6 | 4.0 | 7.9 | 3.7 | 13.3 | 6.7 |
| Dec-21 | 4.5 | 3.2 | 8.3 | 3.6 | 11.0 | 6.6 |
| Jan-22 | 5.6 | 2.5 | 8.8 | 3.5 | 9.3 | 6.5 |
CareEdge View:
Owing to the statistical base effect, retail inflation is expected to be pressured in the next 2 months and is expected to rule over 5%. This is in line with RBI’s inflation projection of 5.7% for Q4. Food inflation is expected to remain under pressure due to soaring vegetable and edible oil prices. Adverse base effect will also add to the upward bias and would limit any moderation on account of robust rabi harvest. Also, hike in telecom tariffs and soaring input prices will keep non-food inflation elevated in the near term. Risks emanating from volatility in the international oil markets amid ongoing geopolitical tensions could further intensify price pressures in the economy. Against this backdrop, we estimate the retail inflation for the year to average around 5.5% with an upward bias.

