By Mudit Sharma, Australian Cotton Shippers Association The world cotton market has seen unprecedented volatility over the last few months and it looks like this volatility is set to continue. In this update, we will try to bring together some of the major underlying themes.
Since 2013/14 (comparing to 2021/22), world production has dropped 5 M (million) to 115 M bales (480 lb equivalent); consumption increased by 7 M to 116 M bales and world ending stocks down 7 M to 86 M bales. The World Agricultural Supply and Demand Estimates (WASDE) for 2022/23 projects world production at 115 M, consumption at 110 M – raising ending stocks to 91 M. This change is mainly due to a drop in consumption and is the macro-theme behind cotton prices.
What is significant with the WASDE number is the decreased consumption (122 M to 110 M) between reports in May 2022 and March 2023.
This picture looks even more interesting if we focus on world supply and demand outside of China. Since 2013/14 China has reduced its reserve stocks from 50+ M to now under 12 M. China has a natural deficit (production minus consumption) of 7 M to 11 M bales – which means it needs to import other growths. Since 2020/21 China has
been importing 7.5-12.8 M bales each year, which has resulted in stocks outside of China to deplete from 62 M to 47 M. Any upsurge in Chinese cotton consumption vis-à-vis imports will further tighten global stocks.
This brings us to the next important question, how is world consumption looking for 2022/23 season? During
the global financial crisis, consumption decreased to 12.9 M bales year on year but was up 10.6 M in 2009/10. During the 2011/12 rally, consumption dropped to 12 M year on year but recovered fully over the next four years.
During Covid, 2019/20 consumption dropped 15.7 M but in 2020/21 increased by 19.1 M. There is a history of massive drops in consumption when times are tough but recovery is then solid. Global supply/demand is intricately balanced right now. Any massive change in consumption either way will influence the stock situation outside of China.

Some of the recent indicators of demand look encouraging. Inventory at retailer and wholesaler level in the US peaked in the Dec-Jan period; consumer offtake data looks good; anecdotally we hear capacity utilisation is expanding from 40-50% in Aug-Dec to now 70-80% in most of Asia/South Asia including China; and yarn margins look thin but stable. We must be cautious here though as all these are early indicators only – or snippets of a picture which is still being painted.
These themes bring our attention to some of the recent changes in world supply/demand and key trends we should
be looking out for. In its March update WASDE raised beginning stocks for China by 1.25 M bales and world stocks
by 870,000 to 86.1 M, which was bearish to begin with. Then they raised production in China by 1 M bales and Australia by 500,000 bales while at the same time cutting world consumption by 550,000 bales. Interestingly Turkish consumption was dropped by only 300,000 bales despite the earthquake and Pakistan with a financial crisis by only 200,000 bales. Overall world ending stocks were raised by more than 2 M to 91 M bales. ICE futures reacted to such bearish changes and dropped 4-5 cents over the next 3 weeks.
A key factor to look out for here is the dynamics of the US balance sheet – for the current and next year. Since November 2022, the US cotton crop has been raised 650,000 to 14.7 M with no changes in last three updates and domestic use dropped 200,000 to 2.1 M. All this should mean US exports must go up, but contrary to expectations US exports dropped 500,000 to 12 M. All these changes meant US ending stock projections for 2022/23 season went from 3 M in November to 4.3 M in March. The logical question emerging here is why US exports dropped despite excess supply and the answer lies in logistics.
US shipment pace has been lagging significantly versus the pace needed to meet WASDE projections. To end February, average shipments per week from US were at 165,000 bales while the minimum pace required was close to 265,000. March data was promising and it seems the US has finally caught up with its required pace. If its latest shipment pace can be sustained for the balance 18 weeks of this season, WASDE will have to raise US exports making the US balance sheet tighter, which will impact on current crop Futures months.
For the upcoming 2023/24 season, we find the US is again at a crosshair, first crop estimates by the National Cotton
Council projects the crop at 15.7 M, which using 12.5 M exports leads to a 5.3 M projected carry out, which sounds big and slightly bearish. But the US balance sheet can play out in various scenarios. Firstly 2023/24 beginning stocks could be down 0.5-0.7 M depending on how US shipments work out for the balance of 2022/23 season and a major kicker is the abandonment factor in Texas. For 2022/23 abandonment was 45% and in 2021/22 it was 8%. Currently most 2023/24 estimates are using 22-23% versus a 5 year average of 25%.
The next two months of weather data is extremely critical to determine abandonment. El Niño Southern Oscillation is switching from La Niña to El Niño, which has made weather forecasts around Texas more unreliable. Depending on the final abandonment factor, the 2023/24 US crop ranges from 13 M to 17 M bales, which means a binary between bullish or bearish ICE.
In addition to cotton’s fundamentals, an over-riding theme for the markets has been the macro-economic outlook. As we know, central banks have been raising interest rates regularly since early 2022 to rein in inflation. (US Federal Reserve rates have gone from sub 1% in May 2022 to now 5+% in April 2023 but inflation in the US is still tracking around 5-6% versus 1.5- 2.5% seen in the previous 15 years.) While the inflation rate has come off from its peak, the rate of decline is painfully slow, which is encouraging central banks to continue to slow down economic growth. The puzzling part here is that the US economy is not showing signs of slowing down. Latest indicators in US for chain store sales, employment rates, wage growth, consumer spending, etc indicate that economic activity is close to pre-pandemic levels. We see similar encouraging signs in China, India, South Asia, Australia and parts of Europe.
The tug of war between central banks and the real economy has had secondary implications. World over, currencies have depreciated against the US dollar – more so for developing economies and to the tune of 5% – 60%. Central banks in developing countries are struggling with forex reserves and import driven and debt laden economies
have suffered the most. The textile industry however, especially in South Asia/Sub-Continent is in a sweet spot, as value-added export reparations in US dollars are now worth a lot more domestically; encouraging them to increase
capacity utilisation – but only if they can manage cash flows.
QUALITY LOOKING GOOD
By Michael O’Rielley, Australian Cotton Shippers Association
Although it feels like we just finished picking, ginning, classing and shipping the 2022 crop, the 2023 pick is already in full swing and it looks like the harvest timeframe will be a short one. Ginning and classing of this significantly sized crop may take a little longer though.
This provides an opportunity to reflect on the quality of 2022 and take a look at what the expectations are for the 2023 crop. 2022 saw a lot of rainfall leading up to, and into harvest and this caused the largest colour grade variability seen for some time – possibly ever. In contrast, 2023 crop growing conditions up until this point have been quite the opposite and the weather outlook is encouraging for a dry pick all over.
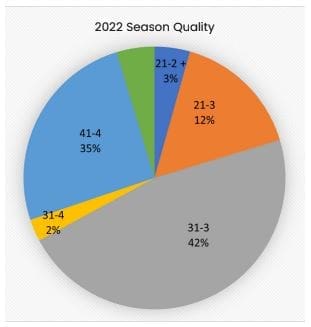
In terms of colour grade the Australian 2022 crop produced 15.36% Strict Middling and better. Strict Middling is what Australia has a reputation for in the global market – it is our poster child. Middling grade came in at 44.28% and Strict Low Middling and lower was 40.36%. (These figures are representative of some 5.54 million bales.)
It is important to highlight that the fibre characteristics which include length, strength and micronaire all maintained their usual consistent high standards that Australia mostly produces year in and year out. Outside of 2022, the Australian crop usually produces approximately 60% Strict Middling and better, 30% Middling and 10% Strict Low Middling and lower.
2022 Season Quality
So what can we expect from 2023 cotton? Based on growing and weather conditions to this point in time, the 2023 crop looks like it will be vastly different to last year, but not dissimilar to the usual production of quality across the Australian crop. Our spinning customers will certainly reap the benefits of our high grades with reliable and consistent fibre characteristics.
Each week as more gins come on line and more cotton is ginned, we have more quality results to view. At this early point of the season, the quality of the crop looks like a return to “normal” production – and the opposite to 2022. The vast majority of classing results I have seen have delivered mostly Strict Middling and better with some
pockets of Middling grade. Fibre characteristics as usual are of a very high standard with many bales coming in at 37 and better and micronaire largely within the G5 range. Strength is also showing good signs at this point with results on an overall basis of around 30 GPT and better.