High-frequency indicators of Nepal’s economy showed moderate signs of recovery in the month ended-mid December. Indicators like inflation, remittance inflows, reserves and trade balance exhibited improvement. However, the performance of indicators like foreign direct investment flows remains worrisome.
Inflation Continues on Downward Trajectory but Non-Food Inflation Remains Sticky
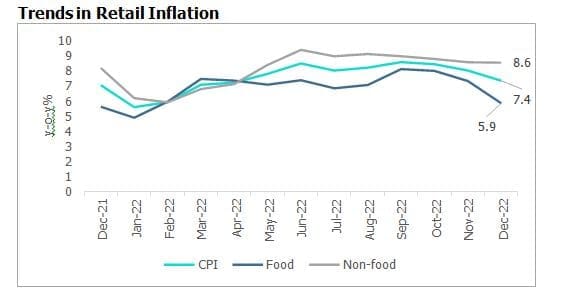
Retail inflation inched down further to 7.4% in the month ended mid-December compared with 8.1% in the previous month mainly due to a favourable base effect and lower food inflation. Food inflation also dropped further to 5.9% in December from 7.4% in the previous month, supported by a fall in vegetable prices. Non-food and service inflation remained sticky at 8.6% on account of high inflation in health, transportation, and housing categories. In the coming months, Nepal’s retail inflation is likely to ease further on account of a favourable base and moderation in global commodity prices.
After remaining in the double-digit range for the past ten months wholesale inflation dropped to 9.2% in the month ended mid-December from 10% in the previous month. In the coming months, easing of commodity and oil prices could further help in lowering wholesale inflation. 
Remittances Remain Robust; Currency Strengthens and FDI Flows Remain Weak
Nepal’s merchandise exports dropped by 39% (y-o-y) to Rs 12.5 billion in the month ending mid-December, as against an increase of 111% in the same period of the previous year. Even on a sequential basis, exports registered a fall for the straight fourth consecutive month. For the same period, merchandise imports decreased 30% to Rs
132.0 billion against an increase of 53% a year ago. The total trade deficit dropped by 28.6% to Rs 119.5 billion in the month to mid-December compared with an increase of 48% in the corresponding period of the previous year.
Reduced trade deficit and robust remittance inflows continue to provide cushion to the overall balance of payments. Remittances continue to record healthy growth and stood almost 42% higher when compared to pre-pandemic period of November 2019. The rise in remittance earnings has been attributed to an increased number of Nepalis going abroad for work opportunities. Nepalese currency also strengthened by 50 basis points against US dollar in mid-December 2022 from the previous month. Foreign direct investment continues to remain anaemic, as FDI flows stood at USD 18.7 million from mid-July to mid-December, almost 70% less in the current fiscal year compared to the same period last year.


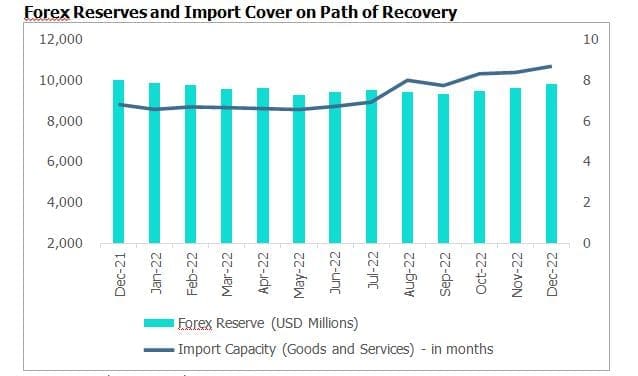
With the rise in remittances income, Nepal’s foreign exchange reserves increased by 2% (m-o-m) to USD 9.8 billion in the month that ended mid-December and remained 2% higher when compared with pre-pandemic level (December 2019). The current level of forex reserve is sufficient to cover imports of goods and services for 8.7 months (higher than the target of 7 months). However, it remained less when compared to average import cover of 12.4 months in 2020/21.
Tourism Sector Shows Signals of Hope
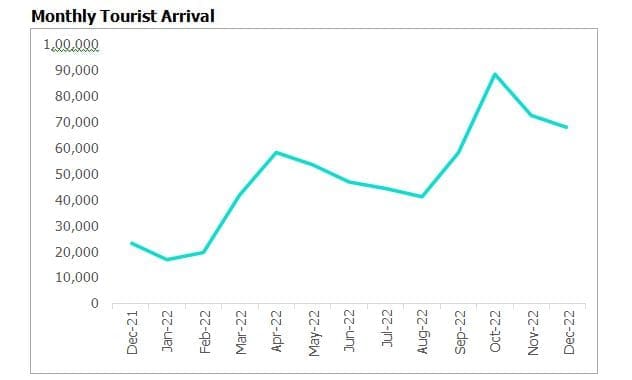
Being the fourth largest employer in Nepal, improved performance of tourism sector will bring cheers to overall economy. A total of 610,907 tourists visited Nepal in 2022, while there were 230,085 and 150,962 tourists in 2020 and 2021, respectively. Moving further, the country’s tourism board expects to host at least 1 million tourists in 2023 as the focus on connectivity and infrastructure increases.
Going ahead, Nepal needs to remain cautious of the global headwinds as major economies of the world are expected to face some form of recession. An economic slowdown could have an impact on tourist arrivals and slowdown in major labour destinations could result in lower remittance inflows.
Monthly Data of Key Economic Variables
| Indicators (Mid-Month) | December 2021 | September 2022 | October 2022 | November 2022 | December 2022 |
| Consumer price inflation (y-o-y%) | 7.1 | 8.6 | 8.5 | 8.1 | 7.4 |
| Wholesale price inflation (y-o-y%) | 7.2 | 14.0 | 13.7 | 10.0 | 9.1 |
| Export growth (y-o-y%) | 111.0 | -40.4 | -37.5 | -24.1 | -39.7 |
| Import growth (y-o-y%) | 52.9 | -13.1 | -22.3 | -23.3 | -29.8 |
| Trade deficit (Rs billion) | 167.3 | 128.4 | 114.3 | 118.7 | 119.5 |
| Worker’s remittances (Rs billion) | 76.1 | 94.8 | 94.0 | 97.0 | 102.4 |
| Foreign exchange reserves ($ billion) | 10.0 | 9.3 | 9.5 | 9.6 | 9.8 |
| Domestic credit (y-o-y%) | 28.4 | 11.7 | 10.5 | 10.5 | 10.1 |
| Deposits (y-o-y%) | 15.9 | 7.4 | 8.2 | 8.6 | 9.5 |
| Bank rate (%) | 4.96 | 8.5 | 8.5 | 8.5 | 7.96 |
| Weighted average deposit rate (%) | 6.24 | 7.81 | 8.16 | 8.32 | 8.46 |
| Weighted average lending rates (%) | 9.29 | 12.06 | 12.19 | 12.65 | 12.74 |
Source: Nepal Rastra Bank

