Textile machinery means the equipment employed directly or indirectly for the processing of textile fiber into yarn and for the manufacture of fabric therefrom by weaving or knitting and includes equipment used either wholly or partly for the finishing, folding, or packing of textiles. Textile Machinery has different types of products like machines for processing textile fibres, suxiliary machinery and parts for textile machinery, weaving ma- chines (looms) and machines for knitting, lace, embroimany in 2021 it was at US$ 10.65million and in 2022 it became US$43.05 million i.e. 304.23%; Netherland it was at US$ 18.22 million in 2020 while in 2022 it inclined by US$26.00 million i.e. 42.70%; in Italy in 2021 it was at US$ 13.35million and in 2022 it became US$22.83million i.e. 71.01%; in Belgium in 2020 it was at US$ 4.71 million whereas in 2022 it went till US$ 21.73 million i.e. 361.36%; in Switzerland in 2020 it was at US$ 8.99million whereas in 2022 it went till US$ 17.77million i.e. 97.66%;
| India – Textile Machinery Import | ||||
| S.No. | Commodity Name | Apr – Mar 2021 | Apr – Mar 2022 | %
Change |
| 1 | Machines for processing textile fibres | 148.88 | 371.87 | 149.78 |
| 2 | Auxiliary machin- ery and parts for textile machinery |
254.76 |
452.31 |
77.54 |
| 3 | Weaving machines (looms) | 262.2 | 460.73 | 75.72 |
| 4 | Machines for knit- ting, lace, embroi- dery, tufting, etc |
188.70 |
353.84 |
87.51 |
| 5 | Machinery for making felt, non- wovens, including hats | 62.23 | 107.55 | 72.83 |
| Total | 916.77 | 1746.3 | 90.48 | |
Machines for processing textile fibres
Machines Imported for processing textile fibres from Japan was highest at US$ 36.15million in 2021 and in 2022 it increased by US$ 133.33million i.e. 268.82%; in China P RP it grew up till 130.81% in 2021 i.e. US$ 78.52 mil- lion whereas in 2022 it was just US$ 34.02million; in Germany in 2021 it was at US$ 10.65million and in 2022 it became US$43.05million i.e. 304.23%; Netherland it was at US$ 18.22 million in 2020 while in 2022 it inclined by US$26.00 million i.e. 42.70%; in Italy in 2021 it was at US$ 13.35million and in 2022 it became US$22.83million i.e. 71.01%; in Belgium in 2020 it was at US$ 4.71 mil- lion whereas in 2022 it went till US$ 21.73 million i.e. 361.36%; in Switzerland in 2020 it was at US$ 8.99million whereas in 2022 it went till US$ 17.77million i.e. 97.66%; in Malaysia in 2020 it was at US$ 5.81 million where- as in 2022 it went till US$ 5.03 million i.e. -13.43%; in Hong Kong in 2020 it was at US$ 1.68million whereas in 2022 it went till US$ 4.3 million i.e. -254.08%; in U S A in 2020 it was at US$ 1.69 million whereas in 2022 it went till US$ 3.00 million i.e. 77.51%;%; in Others in 2020 it was at US$ 13.59million whereas in 2022 it went till US$ 16.31million i.e. 20.01%.
| Machines for processing textile fibres | ||||
| S.No. | Country | Apr – Mar 2021 | Apr – Mar 2022 | %
Change |
| 1 | JAPAN | 36.15 | 133.33 | 268.82 |
| 2 | CHINA P RP | 34.02 | 78.52 | 130.81 |
| 3 | GERMANY | 10.65 | 43.05 | 304.23 |
| 4 | NETHERLAND | 18.22 | 26.00 | 42.70 |
| 5 | ITALY | 13.35 | 22.83 | 71.01 |
| 6 | BELGIUM | 4.71 | 21.73 | 361.36 |
| 7 | SWITZERLAND | 8.99 | 17.77 | 97.66 |
| 8 | MALAYSIA | 5.81 | 5.03 | -13.43 |
| 9 | HONG KONG | 1.68 | 4.3 | 254.08 |
| 10 | U S A | 1.69 | 3.00 | 77.51 |
| 11 | OTHERS | 13.59 | 16.31 | 20.01 |
| Total | 148.86 | 371.87 | 149.81 | |
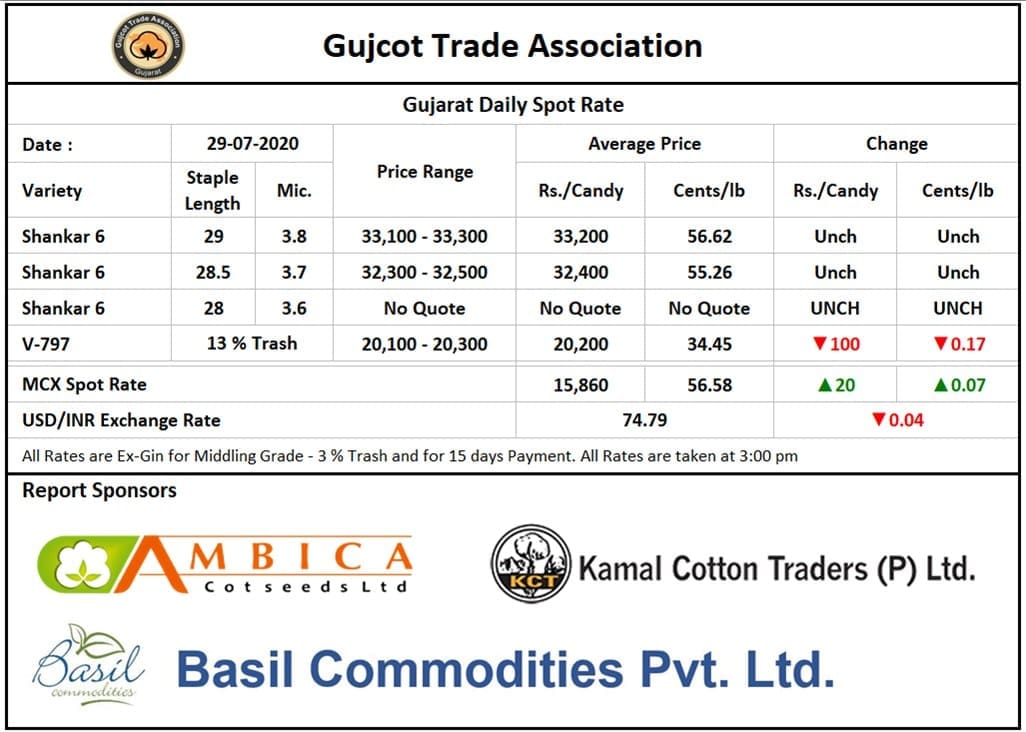
Machines for processing Auxiliary machinery and parts for textile machinery
Machines Imported for processing Auxiliary machinery and parts for textile machinery from China P RP was high- est at US$ 77.78million in 2021 and in 2022 it increased by US$ 171.93million i.e. 121.05%; in Germany in 2021 it was at US$68.26 million and in 2022 it became US$ 121.07 million i.e. 77.37%; in Switzerland it was at US$ 22.77mil- lion in 2020 while in 2022 it inclined by US$31.37million i.e. 37.77%; in Japan in 2021 it was at US$ 23.49 million and in 2022 it became US$30.32 million i.e. 29.08%; in Italy in 2020 it was at US$ 10.18 million whereas in 2022 it went till US$ 15.21million i.e. 49.41%; in Czech Republic in 2020 it was at US$ 1.50 million whereas in 2022 it went till US$ 14.78 million i.e. 885.33%; in Belgium in 2020 it was at US$ 7.55million whereas in 2022 it went till US$13.54 million i.e. 79.34%; in Netherland in 2020 it was at US$13.48 million whereas in 2022 it went till US$9.28 million i.e. -31.16%; in Korea RP in 2020 it was at US$ 5.27million whereas in 2022 it went till US$ 7.43million i.e. 40.99%; in France in 2020 it was at US$ 6.01 million whereas in 2022 it went till US$ 6.98 million i.e. 16.14%; in Others in 2020 it was at US$ 18.45million whereas in 2022 it went till US$ 30.36million i.e. 64.55%.
| Auxiliary Machinery and Parts for Textile Machinery | ||||
| S.No. | Country | Apr – Mar 2021 | Apr – Mar 2022 | %
Growth |
| 1 | CHINA P RP | 77.78 | 171.93 | 121.05 |
| 2 | GERMANY | 68.26 | 121.07 | 77.37 |
| 3 | SWITZERLAND | 22.77 | 31.37 | 37.77 |
| 4 | JAPAN | 23.49 | 30.32 | 29.08 |
| 5 | ITALY | 10.18 | 15.21 | 49.41 |
| 6 | CZECH REPUB- LIC | 1.50 | 14.78 | 885.33 |
| 7 | BELGIUM | 7.55 | 13.54 | 79.34 |
| 8 | NETHERLAND | 13.48 | 9.28 | -31.16 |
| 9 | KOREA RP | 5.27 | 7.43 | 40.99 |
| 10 | FRANCE | 6.01 | 6.98 | 16.14 |
| 11 | OTHERS | 18.45 | 30.36 | 64.55 |
| Total | 254.74 | 452.27 | 77.54 | |
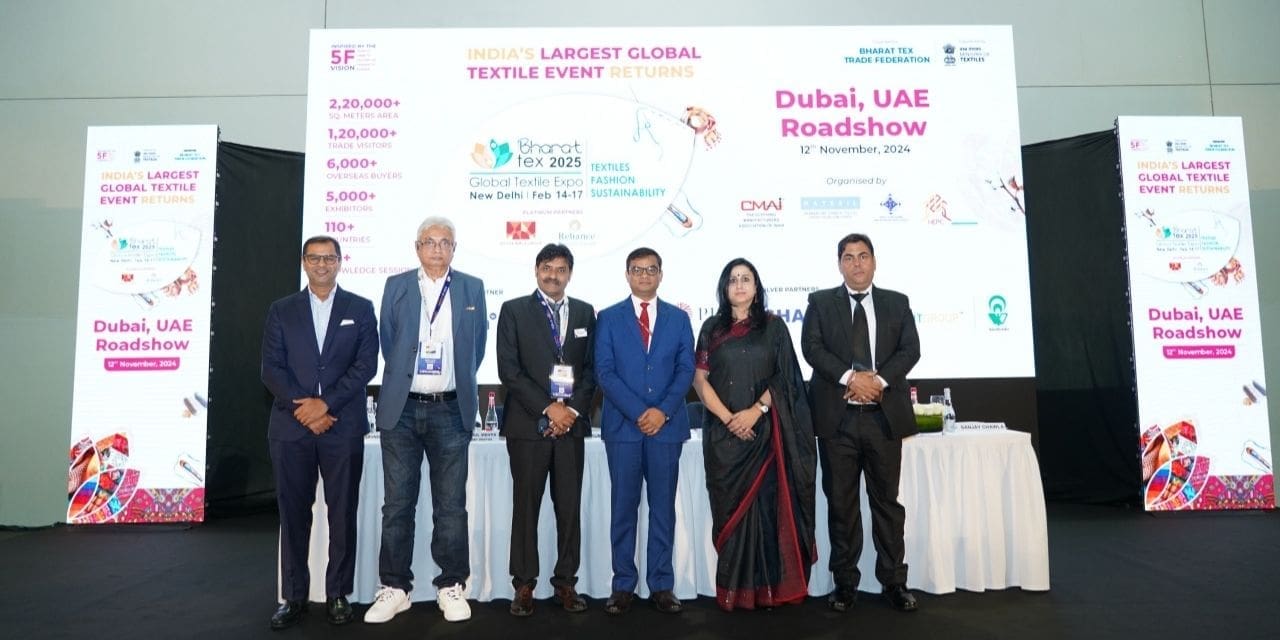
Machines for processing Weaving machines (looms)
Machines Imported for processing Weaving machines (looms) for textile machinery from China P RP was high- est at US$ 131.97million in 2021 and in 2022 it increased by US$ 268.91million i.e. 103.77%; in Japan in 2021 it was at US$35.91 million and in 2022 it became US$ 66.52 million i.e. 85.24%; in Belgium it was at US$ 43.98million in 2020 while in 2022 it inclined by US$52.63million i.e. 19.67%; in Italy in 2021 it was at US$ 23.49 million and in 2022 it became US$30.32 million i.e. 29.08%; in Italy in 2020 it was at US$ 21.35 million whereas in 2022 it went till US$ 27.45million i.e. 28.57%; in U S A in 2020 it was at US$3.83 million whereas in 2022 it went till US$ 8.93 million i.e. 133.16%; in Hong Kong in 2020 it was at US$ 5.26million whereas in 2022 it went till US$8.96 million i.e. 70.34%; in Germany in 2020 it was at US$2.66 million whereas in 2022 it went till US$5.33 million i.e. 100.38%; in Turkey in 2020 it was at US$ 2.19 million whereas in 2022 it went till US$ 5.03 million i.e. 129.68%; in Nether- land in 2020 it was at US$ 0.83million whereas in 2022 it went till US$ 2.21 million i.e. 166.27%; in U ARAB EMTS in 2020 it was at US$ 4.79 million whereas in 2022 it went till US$ 2.07 million i.e. -56.785% ; in Others in 2020 it was at US$ 9.4million whereas in 2022 it went till US$ 12.68 million i.e. 34.89%.
| Weaving Machines (Looms) | ||||
| S.No. | Country | Apr – Mar 2021 | Apr – Mar 2022 | %Growth |
| 1 | CHINA P RP | 131.97 | 268.91 | 103.77 |
| 2 | JAPAN | 35.91 | 66.52 | 85.24 |
| 3 | BELGIUM | 43.98 | 52.63 | 19.67 |
| 4 | ITALY | 21.35 | 27.45 | 28.57 |
| 5 | U S A | 3.83 | 8.93 | 133.16 |
| 6 | HONG KONG | 5.26 | 8.96 | 70.34 |
| 7 | GERMANY | 2.66 | 5.33 | 100.38 |
| 8 | TURKEY | 2.19 | 5.03 | 129.68 |
| 9 | NETHERLAND | 0.83 | 2.21 | 166.27 |
| 10 | U ARAB EMTS | 4.79 | 2.07 | -56.785 |
| 11 | OTHERS | 9.4 | 12.68 | 34.89 |
| Total | 262.17 | 460.72 | 75.73 | |
Machines for processing knitting, lace, embroidery, tufting, etc
Machines Imported for processing knitting, lace, embroidery, tufting, etc from China P RP was highest at US$ 133.65million in 2021 and in 2022 it increased by US$ 239.57million i.e. 79.25%; in Germany in 2021 it was at US$ 10.15 million and in 2022 it became US$ 31.24 mil- lion i.e. 207.78%; in Taiwan it was at US$ 10.78million in 2020 while in 2022 it inclined by US$28.84million i.e. 167.53%; in Japan in 2021 it was at US$ 10.55 million and in 2022 it became US$ 13.88 million i.e. 31.56%; in Turkey in 2020 it was at US$ 1.89 million whereas in 2022 it went till US$ 7.77million i.e. 311.11%; in Korea RP in 2020 it was at US$ 6.37 million whereas in 2022 it went till US$ 6.18 million i.e. -2.98%; in Italy in 2020 it was at US$ 0.78million whereas in 2022 it went till US$6.08 mil- lion i.e. 679.49%; in Switzerland in 2020 it was at US$2.02 million whereas in 2022 it went till US$6.02 million i.e. 198.02%; in U S A in 2020 it was at US$ 3.56million whereas in 2022 it went till US$ 3.83million i.e. 7.58%; in Belgium in 2020 it was at US$ 0.12 million whereas in 2022 it went till US$ 1.93 million i.e. 1508.33%; in Others in 2020 it was at US$ 8.84million whereas in 2022 it went till US$ 8.48million i.e. -4.07%.
| Machines For Knitting, Lace, Embroidery, Tufting, Etc | ||||
| S.No. | Country | Apr – Mar 2021 | Apr – Mar 2022 | % Growth |
| 1 | CHINA P RP | 133.65 | 239.57 | 79.25 |
| 2 | GERMANY | 10.15 | 31.24 | 207.78 |
| 3 | TAIWAN | 10.78 | 28.84 | 167.53 |
| 4 | JAPAN | 10.55 | 13.88 | 31.56 |
| 5 | TURKEY | 1.89 | 7.77 | 311.11 |
| 6 | KOREA RP | 6.37 | 6.18 | -2.98 |
| 7 | ITALY | 0.78 | 6.08 | 679.49 |
| 8 | SWITZER- LAND | 2.02 | 6.02 | 198.02 |
| 9 | U S A | 3.56 | 3.83 | 7.58 |
| 10 | BELGIUM | 0.12 | 1.93 | 1508.33 |
| 11 | OTHERS | 8.84 | 8.48 | -4.07 |
| Total | 188.71 | 353.82 | 87.49 | |