Synopsis
- The non-food credit growth registered a more than 2.5x rise year-on-year (y-o-y) and reached 13.7% in June 2022. The credit growth is expected to be in the range of 12%-13% in FY23, however, rate hikes could adversely impact credit growth.
- NIMs of Scheduled Commercial Banks (SCBs) improved by 6 basis points (bps) y-o-y to 2.92% in Q1FY23 due to a pick-up in credit growth and improvement in asset quality.
- Total income of SCBs rose by 3.4% y-o-y to Rs.3.54 lakh crore in Q1FY23 due to growth in interest income driven by improvement in credit offtake. On the other hand, other income suffered due to elevated mark-to mark (MTM) losses driven by hardening bonds yields.
- SCBs PPOP dropped by 9.3% y-o-y to Rs.91,446 crore in Q1FY23 due to lower/negative profits on the trading book and higher operating expenses.
- Credit cost for SCBs (annualised) declined to 0.7% in Q1FY23 from 1.3% in Q1FY22 and is expected to be lower in coming quarters due to improvement in asset quality.
- The Gross Non-Performing Asset (GNPA) ratio declined to 5.8% as of June 30, 2022, from 7.6% as of June 30, 2021. The GNPA ratio is expected to decline below 5.0% in FY23 and reach pre-Asset Quality Review (AQR) levels of approximately 4.3% in FY24 due to economic expansion, higher recoveries, and proposed transfer of NPAs to various asset reconstruction companies (ARCs).
- Net profit of SCBs grew by 34.0% y-o-y to reach Rs.43,358 crore in Q1FY23 mainly due to lower credit costs. Private sector banks (PVBs) reported a rise of 53.0% in their net profit to Rs.28,050 crore, while PSBs saw an increase of 9.2% to Rs.15,307 crore. Return on assets (RoA, annualised) of SCBs improved by 15 bps y-o-y to 0.92%, while PVBs improved by 39 bps to 1.68% in Q1FY23.
Overview
The non-food credit rose by 13.7% y-o-y as against a growth of 4.9% in June 2021, expanding by a huge 880 bps due to the low-base (coming out of the second wave of Covid), pick-up in the business activities, lower funds raised in the capital markets, and higher demand for working capital. In terms of segmental performance, the credit O/s of the retail loans segment rose at 18.1% y-o-y primarily due to the miniaturization of loans, housing, and vehicle loans. Credit O/s for the industry too rose by 9.5% y-o-y as compared to a drop of 0.6% in June 2021. While credit O/s for services also saw an acceleration to 12.8% y-o-y as compared to 4.0% in June 2021.
Figure 1: SCBs: Movement in Interest Rates (%)
| Month | TDR<1 yr | WALR (O/S loan) |
| Mar-21 | 5.28% | 9.10% |
| Jun-21 | 5.17% | 9.00% |
| Sep-21 | 5.07% | 8.92% |
| Dec-21 | 5.04% | 8.86% |
| Mar-22 | 5.03% | 8.74% |
| June-22 | 5.13% | 8.93% |
Source: RBI
Reduction in Credit Costs Drives Net Profits for Banks in Q1 FY23
- Weighted Average Lending Rate (WALR) for outstanding loans of SCBs dropped by 7 bps y-o-y in June 2022 whereas Weighted Average Domestic Term Deposit Rate (WADTDR) dropped by 4 bps in the same period.
- On a m-o-m basis, however, WALR for outstanding loans of SCBs rose by 14 bps to 8.93% in June 2022, whereas WADTDR rose by 6 bps to 5.13%. Interest rate has been trending down since September 2019 due to favorable monetary policies, however trend has reversed since April 2022 and expected to continue due to increase in policy rates driven by elevated inflation.
- Meanwhile, MCLR has moved by 15 bps m-o-m to 7.4% in June 2022. Post the announcement of rate hikes and higher rates being offered by banks for bulk` FDs, many banks have increased their MCLR and further, it is expected to go up.
- RBI has already increased the repo rate by 140 bps to 5.4% (three hikes) in FY23 and more hikes are anticipated in the current fiscal due to elevated inflation. Banks have already increased their MCLR and deposit rates, further, they are likely to increase deposit rates due to declining liquidity in the market, upcoming festival season, elevated inflation and widening credit deposit growth rate.
Net Interest Margins
- Net Interest Income (NII) of SCBs grew by 14.3% y-o-y to Rs.1.45 lakh crore in Q1FY23 due to growth in interest income driven by healthy improvement in credit offtake. Meanwhile, the gross advances of SCBs rose by 15.6% y-o-y to Rs.124 lakh crore, while PVBs and PSBs reported an increase of 17.8% and 14.2%, respectively by Q1FY23 end.
- Interest income of SCBs rose by 10.0% y-o-y in Q1FY23 over a year-ago period wherein PVBs rose by 13.3% y-o-y, while PSBs reported a lower rise at 7.9% in the same period.
- Interest expenses of SCBs rose by 6.6% y-o-y in Q1FY23 over a year ago period, wherein PVBs rose by 9.8% y-o-y while PSBs reported a lower rise at 5.2% in the same period.
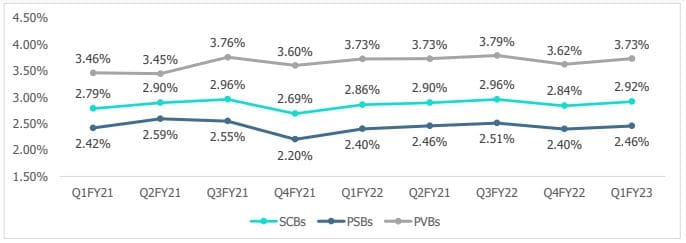
- NII of PSBs and PVBs grew by 11.9% and 17.3% y-o-y, respectively, in Q1FY23. PVBs reported a higher NII growth as compared to PSBs, indicating their strong franchise with both depositors and borrowers.
- NIM of SCBs improved by 6 bps y-o-y at 2.92% in Q1FY23, within this, PSBs improved by 6 bps at 2.46%, whereas PVBs reported a flat NIM at 3.73%.
Total Income
Figure 3: Total Income of SCBs (Rs. Lakh – Crore)
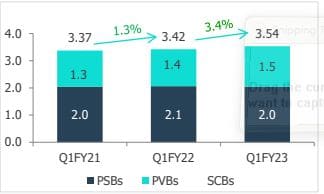
Total income of SCBs rose by 3.4% y-o-y to Rs.3.54 lakh
crore in Q1FY23. Interest income of SCBs grew by 10.0%
y-o-y in Q1FY23, whereas other income sharply dropped
by 29.1% y-o-y due to MTM losses on the investment
book driven by hardening bonds (G-Sec) yields. Other
income of PSBs witnessed a sharper drop of 45.1% y-o-y
compared to PVBs which reported a decline of 6.7% in
Q1FY23.
Operating Expenses (Rs. Lakh – Crore)
Figure 4: Employee Costs Figure 5: Other Op. Expenses Figure 6: Total Op. Expenses
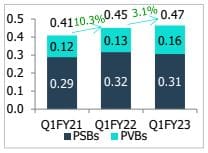
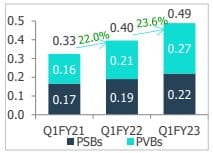
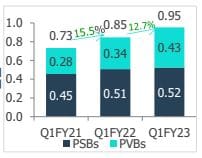
- The operating expenses of SCBs rose by 12.7% y-o-y to Rs.95,315 crore in Q1FY23 due to an increase in other expenses attributed to pick up in retail credit growth (requires higher commission and promotional expenses), investment in technologies, an increase in employee count for PVBs and higher other operating expenses (increased post-Covid second wave on account of collection, opening new branches). Other operating expenses accounted for 51.3% of total operating expenses in Q1FY23 vs 46.7% in Q1FY22.
- Operating expenses of PSBs saw a marginal rise of 3.6% y-o-y for Q1FY23 due to drop in employee expenses on account of lower employee base, however, other operating expenses rose by 15.0% y-o-y.
- Operating expenses of PVBs saw a rise of 26.3% y-o-y in Q1FY23 as other operating expenses rose by 31.5%, and employee expenses increased by 18.4% due to increase in employee base.
Figure 7: Movement of Cost to Income Ratio and PPOP Margin
| Q1FY21 | Q1FY22 | Q1FY23 | |
| Cost to Income Ratio (%) | |||
| PSBs | 50.5% | 48.7% | 54.1% |
| PVBs | 38.7% | 41.7% | 47.8% |
| SCBs | 45.3% | 45.6% | 51.0% |
| PPOP Margin (%) | |||
| PSBs | 1.6% | 1.8% | 1.4% |
| PVBs | 2.9% | 3.1% | 2.6% |
| SCBs | 2.1% | 2.3% | 1.8% |
• Cost to income ratio of SCBs increased by 540 bps y-o-y to 51.0% due to faster growth in operating expenses, and sharp drop in other income.
• PPOP of SCBs dropped by 9.3% y-o-y to Rs.91,446 crore in Q1FY23 due to a sharp decrease in other income and higher growth in operating expenses. PPOP margin of SCBs dropped by 43 bps y-o-y to 1.8% in Q1FY23.
Asset Quality
Figure 8: Gross and Net NPAs (Rs. Lakh – Crore) Figure 9: Gross NPA Ratio (%)
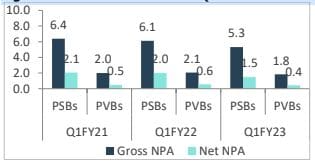
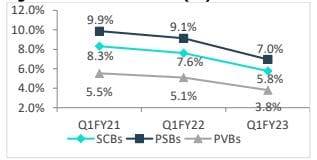
• Despite an increase in advances by 15.6% (y-o-y), the GNPAs of SCBs dropped by 12.5% to Rs.7.2 lakh crores as of June 30, 2022, vs Rs.8.2 Lakh crores as of June 30, 2021. GNPAs of PSBs reduced by 13.2% y-o-y to Rs.5.3 lakh crore in Q1FY22.
• The GNPA ratio of SCBs reduced to 5.8% as of June 30, 2022, from 7.6% as of June 30, 2021 and 8.3% as of June 30, 2020, which was largely driven by PSBs.
• Generally, banks continued to witness a reduction in slippages. PSBs slippages dropped by 30% y-o-y in Q1FY23 to Rs.36,621 crore from Rs.52,474 crore in Q1FY22.
• The credit cost of the SCBs declined to 0.7% in Q1FY23 from 1.3% in Q1FY22. The credit cost of the PSBs declined to 0.7% in Q1FY23 from 1.2% in Q1FY22, whereas for PVB, it declined to 0.5% in Q1FY23 from 1.5% in Q1FY22.
• Reflecting the improvement of GNPAs, and due to significant provisioning, the Net Non-Performing Assets (NNPAs) of SCBs too dropped by 25.9% y-o-y to Rs.1.9 lakh crore in Q1FY23. The NNPA ratio of SCBs too reduced to 1.6% in Q1FY23 from 2.5% in Q1FY22. NNPAs of PSBs dropped by 120 bps y-o-y to 2.0% where as PVBs reported a drop of 60 bps y-o-y to 0.9% in Q1FY23.
Figure 10: Slippages of Select Banks (Rs. Crore)

• Overall, recoveries of SCBs improved as the business activities picked post the Covid-19 situation.
• As per the FSR (RBI), the aggregate GNPA ratio of PSBs and PVBs in the MSME sector has moderated to 9.3% in March 2022 from 11.3% in September 2021. It remains relatively high to the aggregate level of GNPAs in the sector. In the rising interest rate scenario, weaker MSMEs are expected to face challenges, hence, the performance of restructured accounts continues to be monitorable in the current fiscal.
Provisions and Contingencies (Profit & Loss)
Figure 11: Provisions and contingencies (Rs. Lakh – Crore)
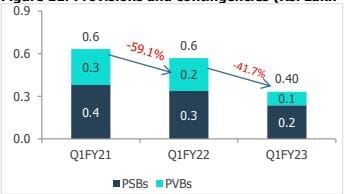
• Provisions created by SCBs declined by 41.7% y-o-y to Rs.0.4 lakh crore in Q1FY23, the lowest in the last six quarters due to improvement in asset quality and with banks already holding a substantial buffer for provisions.
• The banks had created more than the required level of provisioning to manage uncertainties caused by the pandemic, however, with the banks not having fully utilized the same, has led to lower incremental provisions.
• With the banks maintaining provisioning buffers, the Provision Coverage Ratio (PCR) has generally been on an uptrend. The aggregate PCR (calc) has improved by 440 bps (y-o-y) to 73.3% in Q1FY23.
Capital Adequacy (CAR)
Figure 12: Capital Adequacy Ratio under Basel III (%)
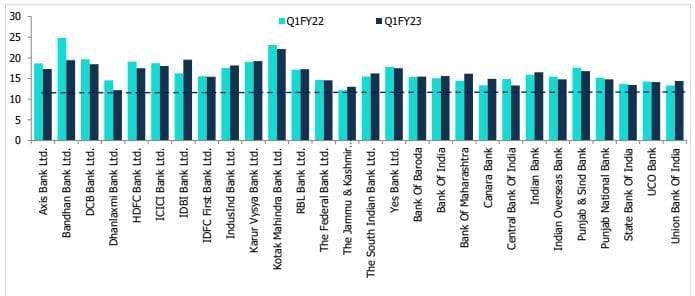
All SCBs have maintained CAR greater than the minimum required ratio for Q1FY23. indicating that the banks are adequately capitalized. To support the anticipated credit growth, banks are expected to shore up their liability franchise by raising capital and deposits in FY23. The market has been facing liquidity issues and elevated inflation, hence borrowing costs for the deposits and the cost of raising capital are expected to go up in the coming quarters.
Net Profit and Return on Assets
Figure 13: Trend in net profit (Rs. Lakh, Crore) Figure 14: Movement of RoA (annualized, %)
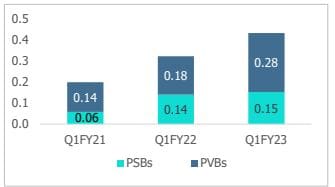
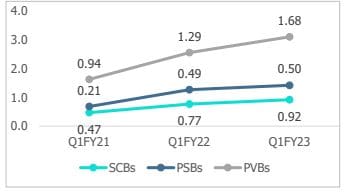
• The net profit of SCBs grew by 34.0% y-o-y to Rs.43,358 crore in Q1FY23 due to a substantial decline in provisions. However, a drop of 9.3% in PPOP offset the reduction of lower provisions. In absolute terms, total provision of SCBs dropped by Rs.23,725 crore y-o-y in Q1FY23 whereas net profit rose by Rs.11,007 crore in the same period. The net profit of PVBs rose by 53.0% y-o-y to Rs.28,050 crore in Q1FY23 whereas PSBs reported a rise of 9.2% to Rs.18,338 crore.
• The RoA of SCBs improved by 15 bps y-o-y from 0.77% in Q1FY22 to 0.92% in Q1FY23 whereas PVBs improved by 39 bps to 1.68% in Q1FY23. However, the RoA of PSBs was almost flat increasing by 1 bps at 0.50% in Q1FY23 (y-o-y).
Conclusion
• The banking sector has continued to report improved financial parameters in Q1FY23 and this momentum in credit growth and operational performance is likely to continue in FY23. The credit growth is expected in the double digits for FY23; however, key risks include elevated inflation and further rate hikes.
• RBI has already increased the repo rate three times to control inflation and more hikes are anticipated in FY23. Deposit rates are also expected to rise as the intensity of the competition for deposits would increase due to liquidity deficit, strong credit demand, and widening credit and deposit growth rate.
• Banks that have a higher CASA share and proportion of floating loans are expected to benefit and protect the NIM in the current rising interest scenario. Further, the banks have already witnessed significant treasury losses in Q1FY23, incremental MTM losses are not likely to be as severe in coming quarters thereby assisting profitability.
• The GNPA ratio of SCBs is expected to improve from 5.9% in FY22 to reach around 5.0% in FY23 and pre-AQR levels of approximately 4.3% in FY24. The performance of restructured accounts continues to be monitorable in the current fiscal, especially for the MSME segment.
• Banks have raised substantial capital over the last few years and currently maintain adequate capital.
Consequently, the incremental requirement for capital is likely to be lower and would primarily be undertaken to support credit growth.

