92.9 mnsq ft gross leasable area across 271 operational malls in eight Indian cities
One-third of India’s total mall stockmeasuring 31.7 mnsq ft in NCR
Mumbai, 13th September2022: Knight Frank India, leading international property consultant in the country, in its latest report‘Think India, Think Retail 2022 – Reinventing Indian Shopping Malls’ cited that the total mall stock across the top eight cities of India is estimated at 92.9million square feet (mnsq ft) of gross leasable area (GLA) as of H1 2022 with 271 operational malls in these cities. An incremental supply of 15.5 mnsq ft was added in the 30 months, despite the disruption of the pandemic during 2020 – 21. In December 2019, 77.4 mnsq ft of gross leasable area was recorded across 255 malls in these cities.NCR contributes the highest, over one-third (34%) of India’s total mall GLA in H1 2022. Mumbai contributedthe second highest GLA at 18%followed by Bengaluru with 17% during the same period.
Only 39% of all mall spaces in India is classified as Grade A mallswith a total GLA with 36 mnsq ft.The total number of malls classified as Grade A is 52 in the top cities. These malls have high occupancy, strong tenant mix, good positioning and active mall management. There are estimated 94 malls in the Grade B category with a GLA of 29.1 mnsq ft which in terms of percentage contribute approximately 31% to the total stock. Grade C malls offer a total GLA of 27.8 mnsq ft contributing 30% to total mall stock in India represented by 125 malls. The proliferation of small sized assets in the initial days of shopping malls has contributed to a significantly high number of mall space with relatively smaller areas.
COMPARISON OF DIFFERENT GRADES – INDIA
|
Parameter |
Grade A | Grade B | Grade C |
| % of Total Operational Malls | 19% | 35% | 46% |
| % of Total Operational GLA | 39% | 31% | 30% |
Note: At the end of H1 2022; Source: Knight Frank Research
GROSS LEASABLE AREA & GRADE WISE CONCENTRATION ACROSS TOP 8 CITIES
| City | Gross Leasable Area | % share of grade-wise malls | ||
| GRADE A (>500,000 sq ft) | GRADE B (500,000 – 100,000 sq ft) | GRADE C (<100,000 sq ft) | ||
| All India | 92.9 mnsq ft |
39% |
31% | 30% |
| NCR | 31.7 mnsq ft | 36 % | 21 % | 43 % |
| Mumbai | 16.1 mnsq ft | 43 % | 22 % | 35 % |
| Bengaluru | 15.2 mnsq ft | 42 % | 50 % | 8 % |
| Chennai | 7.5 mnsq ft | 39 % | 36 % | 25 % |
| Hyderabad | 7.2 mnsq ft | 52 % | 21 % | 27 % |
| Pune | 7.1 mnsq ft | 19 % | 53 % | 28 % |
| Kolkata | 5.6 mnsq ft | 45 % | 48 % | 7 % |
| Ahmedabad | 2.5 mnsq ft | 30 % | 28 % | 42 % |
Note: By Gross Leasable Area at the end of H1 2022; Source: Knight Frank Research
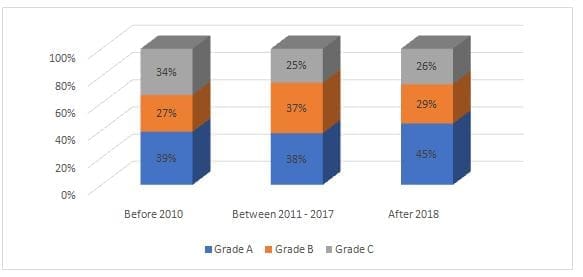
On an account of the number of malls, Grade A noted a constant increase in share of total mall supplyin the past 12 years. Grade A malls witnessed an increase in share of total supply from 39% before 2010 to 45% after 2018. There has been steady increase in share of Grade A mall supplyof, over the last decade. Grade B mall supply registered a marginal growth in share from 27% before 2010 to 29% after 2018.On the contrary, Grade C mall supply recorded a declinein its from 34% before 2010 to 26% after 2018. Grade C malls are still under operation in the country but a vast proportion of this space and are largely strata owned assets. They are slowly fading away from the organised retail scene and are either being used for commercial purposes or are under various stages of dilapidation.
MALL SUPPLY DISTRIBUTION PERCENTAGE BY GRADE

Prior to 2010, a total of 123 developers were active in the retail space, creating shopping centres and malls across different gradesto capture the benefits of the rising retail culture and for some, diversifying their real estate portfolio, However, as retail spaces started to evolve as a lifestyle destination, we saw a rise in demand for quality retail spaces. Thus, in the period between 2011 – 17, the retail mall developer community rationalised k to 93 developers. This number reduced further post 2018, as consolidation in the retail mall development play continued and Grade A mall spaces became the cynosure of consumers.In the period after 2018, only a handful of mall developers continued to survive. Having learnt from past mistakes, the mall developer community consists of nearly 33 players now who have the execution capacity, credibility and a good track record of mall management.
Sharing an overview on the ‘Mall Culture’ in India, Shishir Baijal, Chairman & Managing Director at Knight Frank India said, “The retail real estate sector has reached a new level of maturity where smaller sized and lower grade developments are giving way to Grade A malls. The existing Grade A malls have over 95% occupancy which is indicative of the demand for quality real estate in this segment. Given that retail malls are experiential, more of the future developments will want to create destinations. Therefore, scale and quality of development would require developers to specialise in shopping centre development and operations. Like the office segment, post consolidation, retail real estate too will offer great opportunity for investments including REITs in the future.”

