US$ 1 million could buy nearly 2% more residential space in Mumbai, Delhi and Bengaluruin 2021
- Dubai (44.4%), Moscow (42.4%), San Diego (28.2%), Miami (28.2%), and The Hamptons(21.3%) are the top primeresidential markets basis the PIRI 100
- Global luxury residentialmarkets register an average price rise of 8.4% in 2021, a massive leap from 1.9% growth in 2020
- APAC records a growth of 7.5%, with Seoul (21%) and Taipei (18.9%) making it to top 10
- Prime property markets in Bengaluru and Mumbai record a marginal price growth of 0.3% each; Delhi remains unchanged
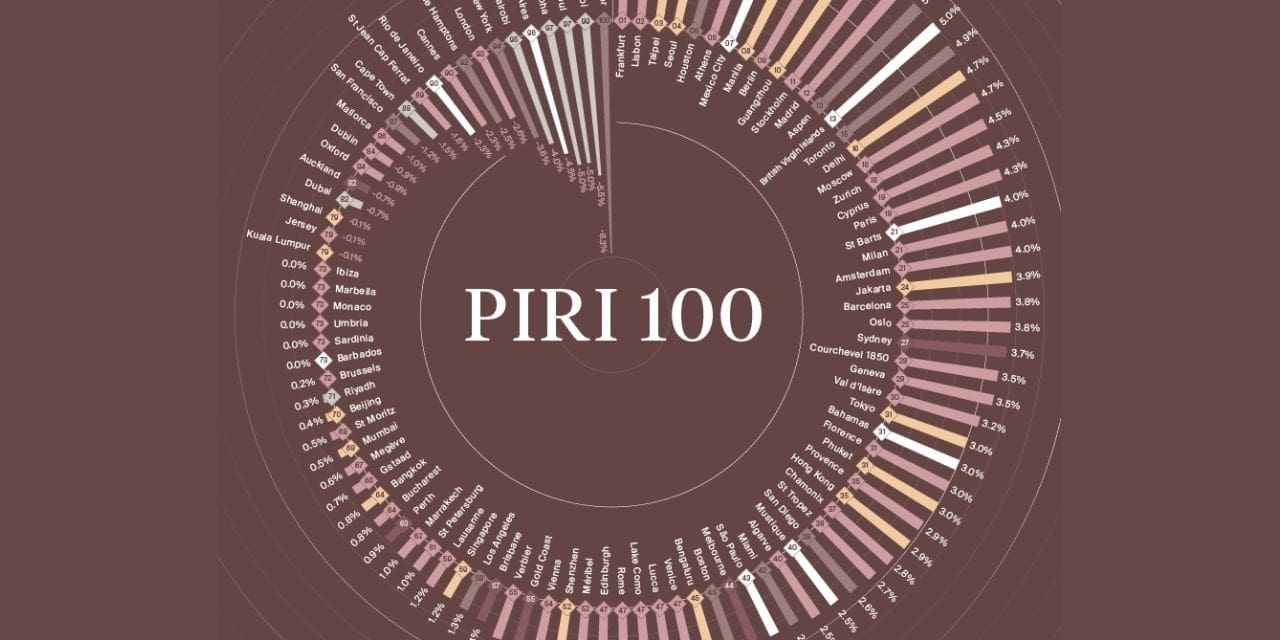
Mumbai, March 1, 2022: According to Knight Frank’s The Wealth Report 2022, the value of Prime International Residential Index (PIRI100) increased by 8.4% in 2021, up from approximately 2% in 2020 – its highest annual increase since the index was launched in 2008. Of the 100 luxury residential markets tracked, a staggering 35% of locations saw prices increase by 10% or more, underlining the strength of the sellers’ market during the pandemic. Only seven locations saw prices decline in 2021.
APAC registered a growth of 7.5% YoY in 2021, with Seoul and Taipei making it to the top 10 list globally. Seoul ranked 6th recording an annual growth of 21% in 2021 whereas Taipei recorded an annual growth of 18.9% ranking 8th globally.With respect to the PIRI 100 list, Dubai tops the index at 44.4%.
Globally, Bengaluru(ranked 91st)andMumbai (ranked 92nd) recorded a marginal growth of 0.3% YoY in 2021in terms of luxury residential prices. Delhi (ranked 93rd)remainedunchangedin regards with prime residential prices.
The prime residential prices are expected to grow further by 10%-12% during 2022 globally. Even the Asian cities are expected to witness a price growth with a slight trail during 2022.
The PIRI 100:Luxury residential markets’ performance, annual price change(2020 – 2021)
All price changes are in local currency.
| No. | Location | Annual % change |
| 1 | Dubai | 44.4 |
| 2 | Moscow | 42.4 |
| 3 | San Diego | 28.3 |
| 4 | Miami | 28.2 |
| 5 | The Hamptons | 21.3 |
| 6 | Seoul | 21.0 |
| 7 | Toronto | 20.3 |
| 8 | Taipei | 18.9 |
| 9 | San Francisco | 18.6 |
| 10 | Los Angeles | 18.5 |
| 91 | Bengaluru | 0.3 |
| 92 | Mumbai | 0.3 |
| 93 | Delhi | 0.0 |
Source: Knight Frank – The Wealth Report 2022 (PIRI 100)
Kate Everett-Allen, head of international residential research at Knight Frank, said:“The UAE’s handling of the pandemic, strong take-up of the vaccine, delivery of high-end turnkey projects as well as innovative new visa initiatives and economic reforms, have together boosted Dubai’s profile in the eyes of international buyers. The top end of the market has been particularly active – sales above US$10m have historically accounted for 2% of all transactions but in 2021, they equated to 7%.”
HOW MUCH SPACE CAN US$1 MILLION BUY?
Monaco continues its reign as the world’s most expensive city where US$ 1 million can get you 14.6 square metres of space, followed by Hong Kong (21.3 sq. mt.) and London (30.6sq.mt.) in 2021. Comparatively in Mumbai, one can purchase 108.1sq. mt. (1164.02sq.ft.) of prime residential real estate,making the city affordable by 2% since in 2020. In Delhi, one can purchase 206.1 sq. mt. (2,218 sq.ft.) and 357.3 sq. mt. in Bengaluru (3,845.9 sq.ft.) of prime residential real estate with an increase of 2.03% and 1.76% respectively.
ShishirBaijal, Chairman & Managing Director, Knight Frank India, said, “2021 was the year of anomalies. Beyond the numbers which speak for themselves, what is remarkable is the resilience of the real estate market in India. Despite multiple waves of the pandemic, which resulted in multiple lockdowns, the residential real estate market has not only bounced back but is also on the cusp of a cyclical upturn. A period of recalibration is likely in 2022 as housing markets regain some of their usual seasonality and borders reopen, with COVID-19 suppressors – rather than eliminators – winning out. This will enable cross-border transactions to slowly recover; a key component of demand that has been largely absent from prime markets since the start of the pandemic.”
Area (in square meters) purchasable for US$1 million over the last 5 years for Mumbai, Delhi and Bengaluru:
| Cities | 2017 | 2018 | 2019 | 2020 | 2021 |
| Mumbai | 92 | 100 | 102 | 106 | 108.1 |
| Delhi | 188 | 201 | 197 | 202 | 206.1 |
| Bengaluru | 311 | 224 | 336 | 351 | 357.3 |
Source: Knight Frank Research
How many square metres of prime property does US$1million* buy in key cities?
| City | Area in square metres |
| Monaco | 14.6 |
| Hong Kong | 21.3 |
| London | 30.6 |
| New York | 33.3 |
| Singapore | 35.4 |
| Geneva | 37.1 |
| Sydney | 41.4 |
| Shanghai | 42 |
| Los Angeles | 42.2 |
| Paris | 42.3 |
| Beijing | 55.8 |
| Tokyo | 64.3 |
| Berlin | 73 |
| Miami | 77.4 |
| Melbourne | 84.3 |
| Madrid | 105.5 |
| Mumbai | 108.1 |
| Dubai | 136.5 |
| Cape Town | 219.5 |
| Sao Paulo | 256.3 |
*Exchange rates calculated at 31 December 2021 | Source: Knight Frank Research, Douglas Elliman, Ken Corporation
KEY DRIVERS FOR PRIME RESIDENTIAL REAL ESTATE:
According to Knight Frank’s Wealth Report 2022, low interest rates have been the key factors driving UHNWI to invest in real estate. Rising wages and accrued savings in lockdowns, strong-performing equity markets,record bonuses and upgrading main residences and lifestyles have also been the reasons towards the growing investment in real estate.

