VTM LIMITED FINANCIAL AND BUSINESS ANALYSIS REPORT

1. Introduction
Founded in 1946, VTM Limited - also known as Virudhunagar Textile Mills - is based in India and focuses on producing woven fabrics for market distribution. As a member of the Thiagarajar Group, it has maintained continuous operations within weaving for decades. Although rooted in tradition, the firm operates within a broader national context where textiles serve as both an economic anchor and major job provider.
2. Company Overview
Founded in 1946, VTM Limited has its base in Virudhunagar, Tamil Nadu. Textile items like drills, twills, sateens, piques, jacquards, and dobby weaves form the core of its production. Exports play a notable role, though sales also serve local markets extensively. Instead of vertical integration, it focuses purely on weaving and selling fabric. Performance hinges on precision, equipment strength, and sustained client ties. Despite limited scale, it holds recognition within specialized woven-fabric segments.
3. Promoter Or Founder Intro
Today, oversight rests with K. Thiagarajan, guiding operations through careful investment choices and long-term planning. Rooted in tradition, the enterprise began under Karumuttu Thiagaraja Chettiar, an early architect of what would become VTM within the larger Thiagarajar Group network. Quality fabric production remains central - paired with updated equipment and tighter financial performance. Leadership blends ownership and management, favouring steady expansion, cautious debt use, and measured plant output aimed at overseas markets.
4. Financial Statement Ana Cr lysis
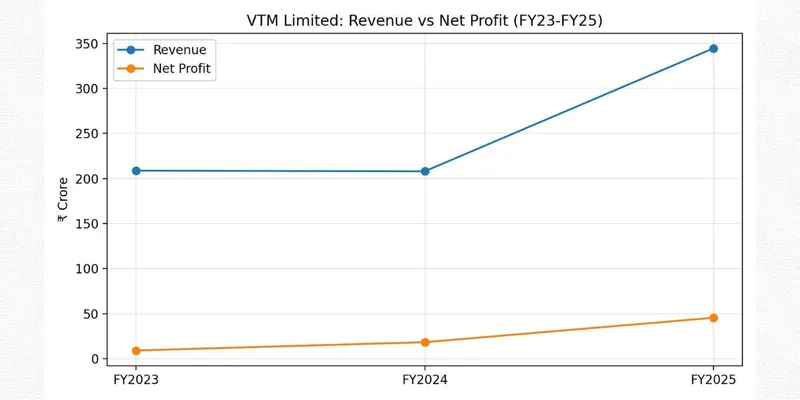
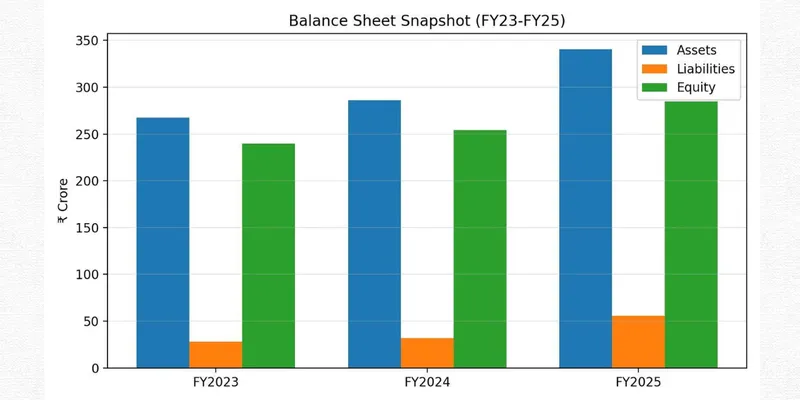
Last three years’ core financial figures for the company appear in the chart above (₹ crore)
Year(₹ Cr) | Revenue
| Net Profit | Total Assets | Total Liabilities | Equity (₹ Cr) | Free Cash Flow (₹ Cr) | Debt | Current Ratio | ROE (%) | ROCE(%) |
FY2023 | 208.7 | 9.1 | 267.6 | 27.8 | 239.8 | 13.6 | 0.02 | 12.96 | 3.81 | 2.9 |
FY2024 | 208.0 | 18.3 | 286.1 | 32.0 | 254.1 | -25.0 | 0.02 | 6.75 | 7.2 | 6.2 |
FY2025 | 344.5 | 45.4 | 340.5 | 55.9 | 284.6 | -59.3 | 0.13 | 3.5 | 15.94 | 18.0 |
Revenue barely changed between FY23 and FY24, staying near ₹208 crore, yet surged to ₹344.5 crore in FY25 - suggesting either rising demand or better pricing power took hold. Profits, though modest at ₹9.1 crore in FY23, doubled by the following year to reach ₹18.3 crore, then more than doubled again to hit ₹45.4 crore in FY25. Such growth hints that higher sales volume unlocked greater margins. When output picked up, earnings responded with disproportionate strength.
Though profits rose, free cash flow dipped below zero in both FY24 and FY25. That shift likely came from increased capital spending or heavier outlays tied to operations during expansion. In manufacturing settings, such patterns aren’t inherently alarming - yet they demand attention. Without strong alignment between earnings and actual cash inflows, ongoing growth might strain available funds over time.
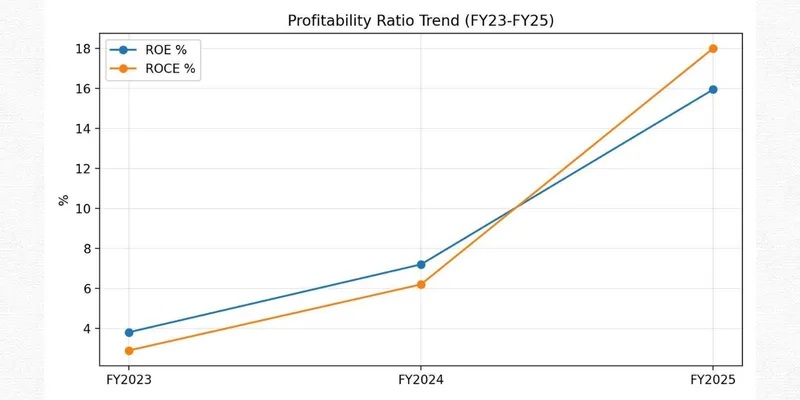
Profitability climbed fast - return on equity jumped from 3.81% in FY23 to 15.94% by FY25, while return on capital employed rose even more, hitting 18.00%. Although debt relative to equity stayed minimal at just 0.13x in FY25, signaling cautious borrowing habits, the firm leaned more heavily on short-term financing. Liquidity weakened noticeably; the current ratio dropped from 12.96x down to 3.50x across two years. Despite that dip, levels remain strong - but tighter buffers suggest greater strain from operational cash needs.
Annual Report Reference Past Three Years
Financial Year | Availability | Source |
2022-23 | Available | Screener/BSE annual reports section |
2023-24 | Available | Screener/BSE annual reports section |
2024-25 | Available | Screener/BSE annual reports section / ReportJunction listing |
5. Key Insights And Interpretation
Strengths
- Profit figures have climbed steadily through time, pointing to solid company results. Year after year, earnings move upward – proof of effective operations taking hold.
- A strong return on capital employed shows money is being put to good use. When profits rise relative to investment, it signals smart resource allocation across operations.
- A significant portion of ownership – about three-quarters – rests with promoters, signaling long-term commitment through sustained control. Stability emerges naturally when core stakeholders remain deeply invested over time.
Weaknesses
- Valuation sits above average when measured against profit levels. A steep price-to-earnings figure suggests costliness. Earnings do not fully support current share value. Market expectations appear stretched relative to income generated. Price reflects optimism beyond present profitability.
- The last few years brought smaller gains for investors. A downward shift in returns became noticeable over time.A longer wait for customer payments eats into available funds. Cash sits tied up instead of being reused. Money moves slower through the business when invoices take time to clear.
- Because of how the sector operates, earnings vary unpredictably. Sometimes small, sometimes larger – profitability shifts often without warning.
Risk Factors
When consumer spending shifts, the textile business feels it quickly. Demand swings shape how factories operate over time. Economic ups and downs leave clear marks on production levels. What people buy today affects output months later. Market moods ripple through fabric makers in predictable waves.When cotton costs shift, margins often follow. Yarn expenses rising? That pressure shows up downstream. Profit pools shrink if input bills climb without warning. Unstable fiber markets make forecasting harder than usual. Margin health ties closely to what happens on commodity floors.
Future Outlook
- Fueled by rising demand, premium textiles may open new market paths abroad. Still, expansion hinges on how well producers adapt to shifting export conditions.
- Profitability often rises when companies streamline how they manage day-to-day financial resources. A tighter grip on cash flow allows more room to reinvest without relying on outside funding.
- Ahead of immediate concerns, long-term prospects appear solid due to sound underlying conditions. Still, near-term challenges linger despite favorable foundations.
6. Conclusion
A shift toward better financial health marks VTM Limited’s position in FY25 compared to earlier periods. Profits have turned upward after previous struggles, signaling recovery. Returns on invested funds now show noticeable strength. Debt remains limited when viewed alongside peers. Despite progress, challenges persist beneath the surface. Investors focused on smaller companies within textiles might find this case interesting. Earnings growth adds appeal, yet caution is needed.
7. References
VTM Limited. (2025). Annual report 2024–25. Retrieved from
https://vtmill.com/financial-overview/
Screener.in. (2026). VTM Limited financial data and ratios. Retrieved from
https://www.screener.in/company/VTMLTD/
Moneycontrol. (2026). VTM Limited stock price, financials and analysis. Retrieved from
https://www.moneycontrol.com/india/stockpricequote/textiles/vtmlimited/
Economic Times. (2026). VTM Limited company information. Retrieved from
https://economictimes.indiatimes.com/vtm-ltd/stocks/companyid-