VIJAY TEXTILES

- INTRODUCTION
- Introduction of the company
Vijay Textiles Limited started back in 1990, set up shop in Secunderabad where it still runs today. This name pops up often when people talk about making home fabrics across India. They are in the segment of embroidered cloth and materials meant for furniture coverings. Instead of just one way to sell, they mix big display stores with selling in bulk to others who trade further down the line.
- Industry Overview
- India’s fabric and clothing business makes up close to 2% of the entire GDP.
- Around 11% GVA ( Gross Value Added ) is added by the factories across the country.
- After agriculture, more folks work here than nearly any other field. Employment for over 45 million lives are tied directly to this sector.
- Purpose of the Analysis
- This report looks at how Vijay Textiles Ltd. is doing financially, where it stands in the market and, also checks what's slowing its progress forward.
2. COMPANY OVERVIEW
- Background and History
It began as a trading firm before transitioning to manufacturing in 1993 by acquiring a processing mill in Hyderabad. Over the decades, it expanded from basic grey cloth conversion to high-value-added products like embroidered fabrics and designer home furnishings.
- Business Model
- The company operates an integrated model that includes the procurement of polyester yarn, contract weaving in hubs like Bhiwandi, and in-house processing and embroidery at its Mahaboobnagar facility. Revenue is generated through:
- Wholesale: A pan-India network of dealers.
- Retail: Four major "Vijay Furnishing Malls" in Hyderabad and Secunderabad.
- Key Products / Services
- The main items they offer are as follows:
- Curtains, covering fabric (upholstery), and bed linens.
- Dyed and printed polyester shirting.
- High-end computerised embroidery.
- Market Position
VTL occupies in the domestic home furnishing segment but is currently a "Small Cap" player with a market capitalization of approximately Rs. 11-12 Crores. It focuses on the domestic retail experience in South India, though it faces intense competition from unorganized local players and regional retail giants.
3.PROMOTER /FOUNDER INFORMATION
Name of Promoter | Professional Background | Role in Company Growth |
|---|---|---|
Vijay Kumar Gupta | Commerce Graduate; trained at ASCI, Hyderabad. | Chief visionary; transitioned the business from trading to manufacturing. |
Susheel Kumar Gupta | Experienced Textile Professional. | Handles strategic operations and retail expansion. |
Shashi Kala Gupta | Co-founder and active stakeholder. | Key role in initial promotion and organizational structure. |
4. FINANCIAL STATEMENT ANALYSIS
- Income Statement Analysis
Particulars (Rs. in Cr) | FY 2023 | FY 2024 | FY 2025 (Audited) |
|---|---|---|---|
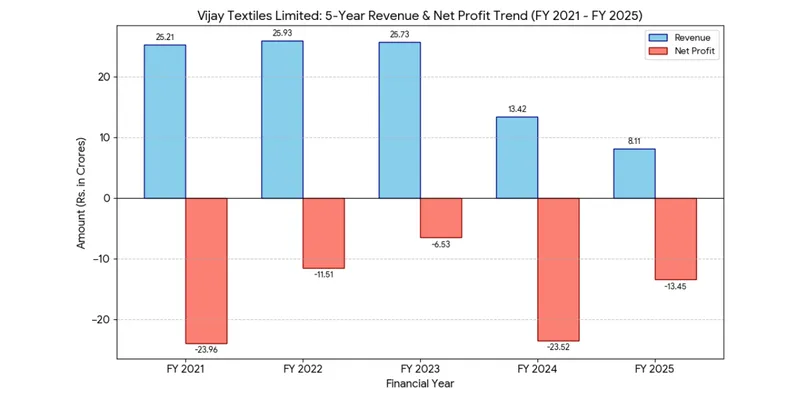
Revenue | 25.73 | 13.42 | 8.11 |
Net Profit (Loss) | (6.53) | (23.52) | (13.45) |
- The company has seen a significant decline in revenue over the last three years, largely due to operational challenges and shifting market demand.
- Revenue has dropped by nearly 68% in the three-year period, reflecting a severe contraction in business volume.
- Revenue Chart
- Balance Sheet Analysis (Rs. In crore)
Component | Amount (Rs. in Cr) |
|---|---|
Total Assets | 12.05 |
Total Liabilities | 14.35 |
Equity Share Capital | 18.31 |
- Asset Deterioration: Non-current assets have decreased as the company struggles to maintain or upgrade machinery.
- Equity Erosion: Accumulated losses have significantly impacted the "Other Equity" portion, leading to a weak net worth.
- Debt Strain: The company remains highly leveraged relative to its current cash-generating ability.
- Cash Flow Statement Analysis (Rs. In crore)
Cash Flow Category | Amount (Rs. in Cr) |
|---|---|
Net Cash from Operating Activities (A) | 2.95 |
Net Cash from Investing Activities (B) | 0.17 |
Net Cash from Financing Activities (C) | (1.07) |
Net Increase in Cash & Equivalents (A+B+C) | 2.05 |
Closing Cash & Cash Equivalents | 14.10 |
FY25 highlights:
- Albeit the net loss, the company pulled in Rs. 2.95 Cr in operating cash. This was possible because accounting items such as depreciation reduced profits on paper but didn’t move actual money out. So while numbers show a loss, real cash came in during the period.
- A tiny gap of Rs. 0.17 crore - shows almost no money going into fresh assets or outlets. Without building more, staying ahead gets harder over time. This might slow down growth.
- Financing cash is negative as the company prioritizes servicing heavy debt and interest, reflecting the pressure of its NPA status.
- A cash balance of Rs. 14.10 Cr is insufficient compared to total liabilities of ~Rs. 150 Cr, leaving the company with very little room for error.
- Key Financial Ratios
Ratio Category | Ratio Name | Value | Interpretation |
|---|---|---|---|
Profitability | Net Profit Margin |
| Severe losses relative to the small revenue base. |
Liquidity | Current Ratio | 3.82 | High on paper, but skewed by high, slow-moving debtors. |
Leverage | Debt-to-Equity | 3.94 | Extremely high; indicates significant financial risk. |
Efficiency | Asset Turnover | 0.05 | Inefficient use of assets to generate sales. |
- Year-on-Year Comparison (3 years)
Particulars (Rs. in Cr) | FY 2023 | FY 2024 | FY 2025 (Audited) | % Change (3yr) |
|---|---|---|---|---|
Total Revenue | 25.73 | 13.42 | 8.11 | -68.48% |
Operating Expenses | 29.81 | 34.05 | 18.28 | -38.68% |
Operating Profit (EBITDA) | (4.08) | (20.63) | (10.17) | N/A |
Net Profit (Loss) | (6.53) | (23.52) | (13.45) | N/A |
Interpretation:
- Revenue Collapse: Sales at the business are down close to 68% since the past three years. It denotes shrinking influence and stores barely holding on.
- Operating Inefficiency: Expenses didn't drop as fast as revenue did. In FY 2024, costs were 2x the Sales, causing the company to bleed cash just to keep the doors open.
- Persistent Losses: A slightly better number last year doesn’t fix years of shrinking value. Losses keep piling up.
- Working Capital Strain: Piles of unsold goods likely sit untouched while payments lingering out of reach. Without steady income, covering everyday costs becomes a
task. Cash flow tightens when customers delay and shelves stay full.
5. KEY INSIGHTS & INTERPRETATION
- Strengths
- Established "Vijay" brand name in the South Indian market.
- Physical retail presence in high-traffic urban areas.
- Weaknesses
- Drastic revenue decline and persistent net losses.
- High debtor turnover period (over 6,000 days).
- Risk Factors
- Loan accounts with SBI and Axis Bank have been classified as Non-Performing Assets (NPAs), creating a massive credit risk.
- Future Outlook
The outlook is bleak unless the company undergoes a debt restructuring or manages a successful pivot into higher-margin infrastructure or technical textile segments.
6. CONCLUSION
Final Evaluation of Financial Health
Vijay Textiles is in a precarious financial state. With falling revenues, mounting losses, and NPA status with major banks, the company’s "Piotroski Score" is low, signaling weak financial strength.
Investment / Performance Perspective
From an investment standpoint, the company represents a high-risk prospect. Until there is a clear turnaround in sales and a resolution of its debt obligations, performance is expected to remain under pressure.
Data Sources
https://www.screener.in/company/530151/
https://simplywall.st/stocks/in/consumer-durables/bse-530151/vijay-textiles-shares/health