UNITED TEXTILES LIMITED

1. Introduction
United Textiles Limited (UNITEDTE) started on November 27, 1993, as a small cotton yarn maker. Its office and factory is in Hisar, Haryana. This company keeps things running steadily. It pulls in real sales of Rs. 10–18 crore a year. Operating profit stays positive, margins get better each year, and book value sits at Rs. 34.9 per share.
This report checks out the UTL's story, its promoters, and finances from FY22 to FY24.
2. Company Overview
Background and History
United Textiles Limited got going in November 1993 in Haryana. It jumped into making cotton yarn. Over the years, it's been added to its plant bit by bit. It went public back in the 1990s and listed on BSE.
Business Model
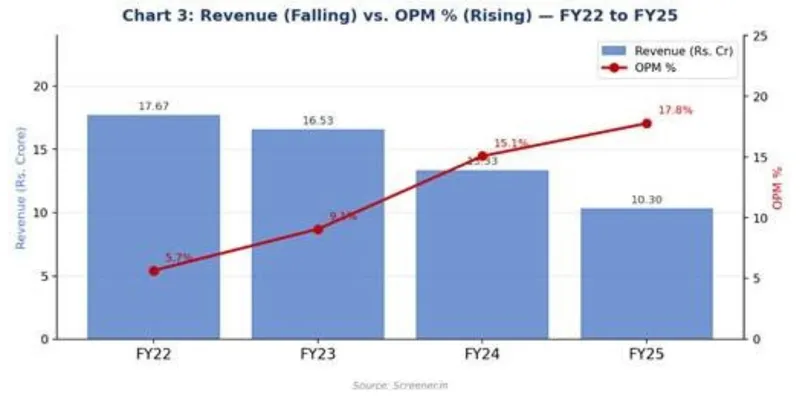
UTL makes cotton yarn at its Hisar plant and ships it to garment and fabric makers. Its lineup has Double Cotton Yarn for finer stuff (higher priced), plus lower-grade Flake and Fly yarns for rougher or industrial use. Sales swing with cotton prices and demand, Rs. 17.67 crore in FY22, down to Rs. 13.33 crore in FY24, and Rs. 10.30 crore in FY25. Operating margins improved from 5.66% (FY22) to 15.08% (FY24) and 17.77% (FY25).
Current Status
Sales kept falling in FY25 and hit just Rs. 0.15 crore in Q3. No dividends were ever paid. Debt ballooned from Rs. 1.63 crore in FY14 to Rs. 9.83 crore in FY25, helping fund expansions that now mean big depreciation hitting profits.
3. Promoter Introduction
Promoters held steady between 31–34% lately, now at 34.58% since December 2023. No pledging shows up. Key promoters and directors from BSE annual reports and filings:
Name | Designation | Note |
Vivek Aggarwal | Managing Director & Promoter | Key promoter; runs day-to-day |
Sonu Aggarwal | Promoter | Promoter family member |
Sonal Atal | Director | Non-executive director |
Sandeep Garg | Independent Director | Non-executive independent |
Amit Bansal | Independent Director | Non-executive independent |
Table 1: Board of Directors (Source: BSE Annual Reports / Business Today)
34.58% promoter holding runs low for manufacturing but not too bad. The Aggarwal family from Hisar looks like the founders. No pledging noted. It dipped to 31.08% in FY19, then recovered to 34.58%, a small sign of confidence.
4. Financial Statement Analysis
4.1 Income Statement (FY22–FY24)
Revenue kept dropping from Rs. 17.67 crore in FY22 to 16.53 crore FY23, then 13.33 crore FY24. Operating profit went up, Rs. 1.00 crore, 1.50 crore, 2.01 crore. Expenses fell faster than sales, so OPM jumped from 5.66% to 15.08%. Interest rose to Rs. 0.64 crore though, and depreciation hit Rs. 1.26 crore in FY24, wiping out most gains. Net profit stayed tiny at Rs. 0.02, 0.03, 0.01 crore.
Particulars (Rs. Crore) | FY22 | FY23 | FY24 |
Revenue (Sales) | 17.67 | 16.53 | 13.33 |
Total Expenses | 16.67 | 15.03 | 11.32 |
Operating Profit | 1.00 | 1.50 | 2.01 |
OPM % | 5.66% | 9.07% | 15.08% |
Interest | 0.35 | 0.40 | 0.64 |
Depreciation | 0.68 | 1.12 | 1.26 |
Net Profit | 0.02 | 0.03 | 0.01 |
EPS (Rs.) | 0.07 | 0.10 | 0.03 |
Table 2: Income Statement Summary — FY22 to FY24
4.2 Balance Sheet (FY22–FY24)
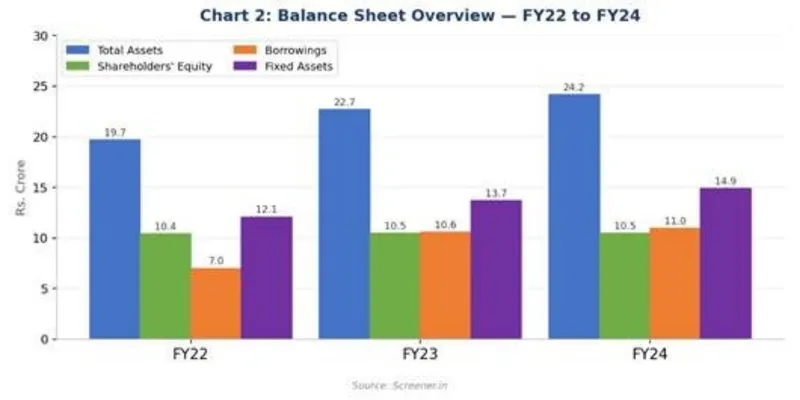
Total assets climbed from Rs. 19.70 crore to 24.17 crore, mostly plant expansions. Reserves held steady around Rs. 7.41–7.47 crore, positive since FY17 after capital came in. Borrowings swelled from 7.01 crore to 10.96 crore, paying for capex but adding debt load. Book value per share hit about Rs. 34.7 in FY24. The company stays solvent.
Particulars (Rs. Crore) | FY22 | FY23 | FY24 |
Equity Capital | 3.00 | 3.00 | 3.00 |
Reserves | 7.41 | 7.46 | 7.47 |
Shareholders' Equity | 10.41 | 10.46 | 10.47 |
Borrowings | 7.01 | 10.59 | 10.96 |
Other Liabilities | 2.28 | 1.64 | 2.74 |
Total Assets | 19.70 | 22.69 | 24.17 |
Fixed Assets | 12.08 | 13.71 | 14.88 |
Book Value/Share (Rs.) | ~34.7 | ~34.9 | ~34.9 |
Table 3: Balance Sheet Summary — FY22 to FY24 (Source: Screener.in)
4.3 Cash Flow
Operating cash looked solid at Rs. 3.50 crore in FY22, then tanked to -Rs. 2.75 crore in FY23 from working capital buildup. It bounced back to Rs. 2.52 crore FY24. Investing cash went out for plant work Rs. -4.98 crore FY22 and -Rs. 2.30 crore FY24. Financing brought in borrowings early on. FY25 ops cash hit Rs. 1.74 crore with debt paydown of Rs. -1.73 crore now trimming debt.
Cash Flow (Rs. Crore) | FY22 | FY23 | FY24 |
Operating | 3.50 | -2.75 | 2.52 |
Investing | -4.98 | -0.41 | -2.30 |
Financing | 1.52 | 3.19 | -0.27 |
Net Change | 0.04 | 0.02 | -0.05 |
Table 4: Cash Flow Summary — FY22 to FY24 (Source: Screener.in)
4.4 Key Ratios
Ratio | FY22 | FY23 | FY24 | Observation |
ROCE % | 2.18% | 2.18% | 3.72% | Low but ticking up |
OPM % | 5.66% | 9.07% | 15.08% | Climbing nicely |
Debtor Days | 33 | 40 | 15 | Super quick pay |
Inventory Days | 48 | 106 | 218 | Ballooning—red flag |
Cash Conv. Cycle | 26 | 99 | 137 | Stretching longer |
Working Capital Days | -8 | -12 | -8 | Runs lean |
EPS (Rs.) | 0.07 | 0.10 | 0.03 | Barely breaking even |
Book Value/Share | ~34.7 | ~34.9 | ~34.9 | Steady shape |
Table 5: Key Financial Ratios — FY22 to FY24 (Source: Screener.in)
5. Key Insights and Interpretation
The OPM Paradox
What really stands out in numbers is sales dropping while margins climb. OPM rose from 5.66% FY22 to 9.07% FY23, 15.08% FY24, even 17.77% FY25. The company got better at costs, maybe higher-end yarns or ditching weak products. Interest at Rs. 0.64 crore plus Rs. 1.26 crore depreciation ate up FY24's Rs. 2.01 crore ops profit. All that borrowed cash for expansions now drags the bottom line.
Rising Inventory Days — Watch Signal
Inventory days shot up from 48 in FY22 to 218 in FY24, then 432 in FY25, a big warning sign. Cotton yarn piles up in the warehouse for over a year unsold. Maybe weak textile demand, or they're holding for higher prices, or just can't move stock. The cash conversion cycle stretched to 137 days FY24 because of it.
Debt Growing — Capex-Driven but Risky
Borrowings climbed from Rs. 7.01 crore to 10.96 crore FY22–FY24 for plant upgrades. Fixed assets hit Rs. 14.88 crore from 12 crore.
Future Outlook
OPM gains look real. If sales steady up, profits could follow. FY25 had solid ops cash and some deleveraging. But Q3 FY26 sales at Rs. 0.15 crore screams trouble, business slowed hard late 2025.
6. Conclusion
United Textiles Limited runs the most normal operation in this series, actual plant, real sales, positive book value, margins climbing from 5.66% to 15.08% FY22–FY24. Ops cash positive two out of three years, book value steady Rs. 34.9 per share.
Problems hit hard though: sales drop, debt up, debt plus interest kill ops profit, inventory over a year old, net profits around zero. Q3 FY26 revenue crash to Rs. 0.15 crore demands answers.
Sources:
- BSE
- Screnner