Uniroyal
1. Introduction
1.1 Company Overview
Since 1993, Uniroyal has been making custom labels and garment accessories out of their Haryana plant. Fast forward to today, they've built a solid reputation supplying everyone from clothing and shoe brands to toy makers—both here in India and globally.
1.2 Industry Overview
The Indian woven-label business is expensive to enter and relies entirely on how well the country's clothing exports are doing. It's a tough market, manufacturers constantly have to fight for cheap, unorganized local competitors who drive prices down, all while dealing with an unpredictable global economy and high interest rates.
1.3 Purpose of This Analysis
This report reviews Uniroyal Industries Limited’s finances, operations, and strategy up to March 31, 2024. It uses the company's audited financial statements, the directors’ report, and management's views. We'll break down income, balance sheet strength, cash flow, and key financial ratios. Our aim is to give investors, researchers, and other involved parties a clear view of Uniroyal's current situation.
2. Company Overview
2.1 Background and History
Uniroyal Industries Limited have been in the game since 1993, hitting their 31st-year milestone in FY24. The Mahajan family starte with Arvind Mahajan driving the initial vision for making woven labels. They've consistently expanded their factory floors and upgraded their gear. Right now, they're running third-generation computerized weaving machines, which is basically what they need to stay relevant against both local and export competition.
2.2 Business Model
They make custom garment accessories to order. They take raw materials, run them through automated machines, and ship the finished products straight to clothing and shoe brands. They also fully own another company—A M Textiles & Knitwears -which gives them a bigger footprint in the broader textile world.
2.3 Key Products and Services
- Computerized woven labels.
- Satin and Taffeta narrow fabrics.
- Printed tags and hang labels.
- Various accessories for clothing, shoes, and even toys.
2.4 Market Position
Uniroyal’s main advantages are modern machinery, long-standing ties with clients, and a good track record with export compliance.
3. Promoter Introduction
Name of Promoter(s) / Founder(s) | Role in Company |
|---|---|
Shri Arvind Mahajan | Managing Director |
Smt. Rashmi Mahajan | Executive Director |
Shri Akhil Mahajan | Executive Director |
4. Financial Statement Analysis
4.1 Income Statement Analysis
Particulars | Standalone FY24 (Rs. Lakh) | Standalone FY23 (Rs. Lakh) | Consolidated FY24 (Rs. Lakh) | Consolidated FY23 (Rs. Lakh) |
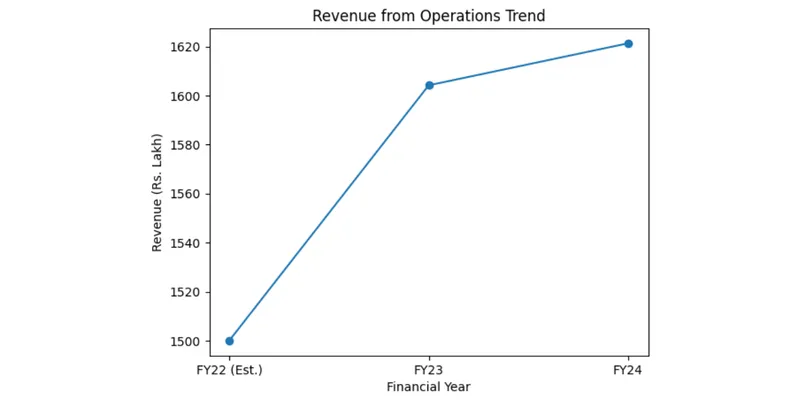
Revenue from Operations | 1,621.32 | 1,604.18 | 9,830.26 | 11,287.33 |
Other Income | 151.33 | 4.57 | 198.40 | 36.80 |
Total Revenue | 1,772.65 | 1,608.75 | 10,028.66 | 11,324.13 |
Total Expenses (excl. fin. cost & dep.) | 1,468.97 | 1,504.56 | 9,535.92 | 10,996.70 |
Finance Cost | 69.90 | 81.05 | 226.20 | 213.52 |
Depreciation & Amortisation | 182.67 | 197.26 | 203.20 | 208.91 |
Profit / (Loss) Before Tax | 51.11 | (174.13) | 63.34 | (95.00) |
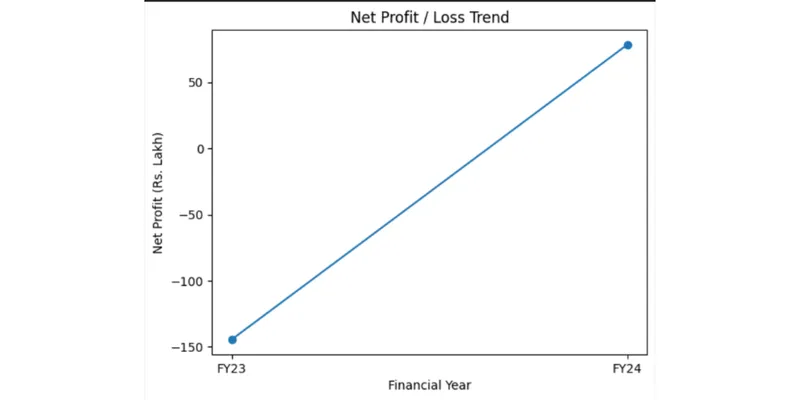
Net Profit / (Loss) | 78.42 | (144.35) | 86.17 | (87.72) |
Key Observations on the Income Statement:
- Holding steady with a tiny 1% bump in sales.
- Overall sales actually dropped 13% because of their subsidiary.
- They swung from a loss to a profit this year but, it was mostly driven by Real Estate Sales, not a sudden boom in everyday business.
4.2 Balance Sheet Analysis
Particulars | FY 2023-24 (Rs. Lakh) | FY 2022-23 (Rs. Lakh) |
Total Non-Current Assets | 1,879.35 | 2,265.82 |
Total Current Assets | 724.21 | 677.93 |
Total Assets | 2,603.56 | 2,943.75 |
Equity Share Capital | 826.87 | 826.87 |
Other Equity (Reserves & Surplus) | 853.09 | 773.66 |
Total Equity | 1,679.97 | 1,600.54 |
Long-Term Borrowings | 178.77 | 266.44 |
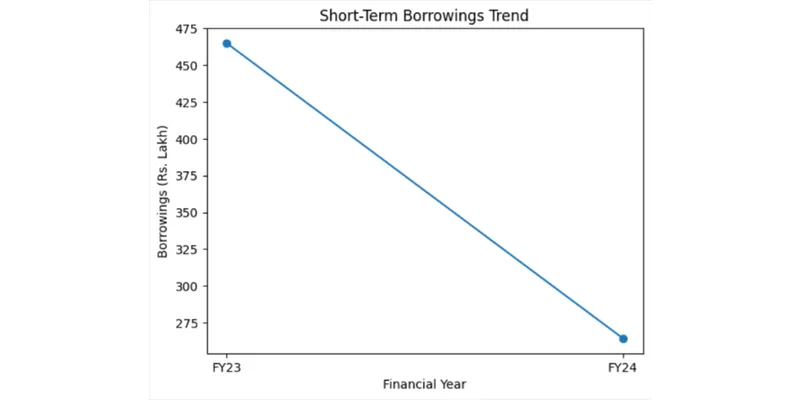
Short-Term Borrowings | 264.40 | 465.10 |
Trade Payables | 146.92 | 155.54 |
Total Current Liabilities | 614.78 | 921.21 |
Total Liabilities (Non-current + Current) | 923.59 | 1,343.22 |
Key Observations on the Balance Sheet:
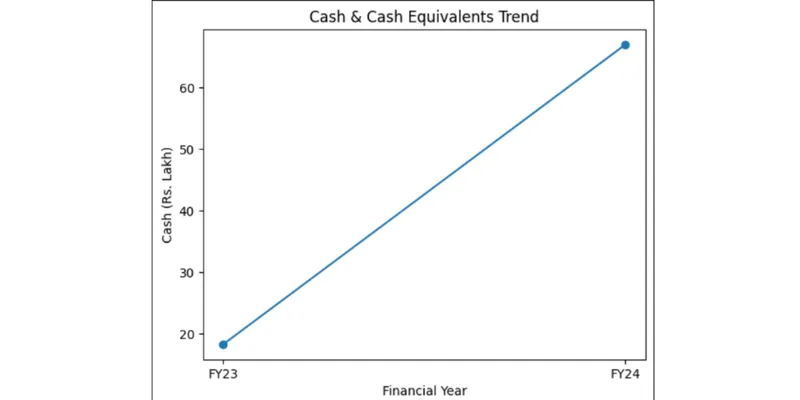
Overall equity grew, and actual cash on hand nearly quadrupled.
They are holding less unsold stock, freeing up even more cash.
Customers are taking longer to pay, so they really need to chase down the invoices.
4.3 Cash Flow Statement Analysis
Activity Head | FY 2023-24 (Rs. Lakh) | FY 2022-23 (Rs. Lakh) |
Operating Cash Flow (A) | 202.09 | 6.91 |
Investing Cash Flow (B) | 204.90 | 0.81 |
Financing Cash Flow (C) | (358.28) | 4.64 |
Net Change in Cash | 48.72 | 12.36 |
Opening Cash Balance | 18.26 | 5.90 |
Closing Cash Balance | 66.98 | 18.26 |
Cash Flow Insights:
- Cash Surge: Everyday cash flow skyrocketed to Rs. 202 lakh after they finally cleared out old inventory.
- Property Payday: They scored a massive cash injection by selling off a property in Chandigarh.
- Killing Debt: Instead of blowing that windfall, they used it to aggressively wipe out over Rs. 358 lakh in loans and interest.
4.4 Key Financial Ratios
Ratio | FY 2023-24 | FY 2022-23 | Interpretation |
Net Profit Margin (%) | 4.84% | Negative | Sharp turnaround; profitable year |
Return on Equity (%) | 4.67% | Negative | Positive returns to shareholders |
Current Ratio (x) | 1.18x | 0.74x | Improved — now above 1, healthier |
Debt-to-Equity Ratio (x) | 0.27x | 0.51x | Significant deleveraging achieved |
Interest Coverage Ratio (x) | 1.73x | Negative | Earnings now cover interest costs |
Inventory Turnover (x) | 7.56x | ~5.9x | Faster inventory movement |
Trade Receivables Turnover (x) | 4.06x | ~3.8x | Moderate collection efficiency |
Earnings Per Share (Rs.) | Rs. 0.96 | Rs. (1.73) | Positive EPS; loss to profit swing |
4.5 Year-on-Year Comparison — Three-Year Financial Snapshot
Metric | FY 2021-22 (est.) | FY 2022-23 | FY 2023-24 |
Revenue from Operations (Rs. Lakh) | ~1,500 (est.) | 1,604.18 | 1,621.32 |
Net Profit / (Loss) (Rs. Lakh) | Positive trend* | (144.35) | 78.42 |
Total Equity (Rs. Lakh) | ~1,743 (est.) | 1,600.54 | 1,679.97 |
Short-Term Borrowings (Rs. Lakh) | Higher levels | 465.10 | 264.40 |
Cash & Equivalents (Rs. Lakh) | ~5.90 | 18.26 | 66.98 |
5. Key Insights & Interpretation
5.1 Strengths
Paid down over Rs. 200 lakh in short-term debt within a year, effectively halving the debt-to-equity ratio and lowering financial risk.
Operating cash flows reached a multi-year high of Rs. 202 lakh, demonstrating strong liquidity and a highly viable core business.
Supported by three decades of management expertise, modern imported machinery, and a flawless compliance record with zero litigation.
5.2 Weaknesses
Their bottom line only looks good because they sold an apartment. Without that one-time real estate cash, their actual profit margins are uncomfortably thin.
Their side company is weighing them down, with its revenue dropping by almost 13%.
Even though their sales haven't grown, the amount of money customers owe them rised. Basically, clients are taking much longer to pay their bills.
5.3 Risk Factors
- Informal manufacturers keep undercutting us on price, making it tough to maintain premium margins.
- If the garment or toy industries sneeze, we catch a cold. We're a bit too dependent on those specific sectors.
- Spikes in raw material or power costs hit us hard because they make up such a huge chunk of our expenses.
5.4 Future Outlook
Management is optimistic about the year as demand is picking up everywhere.
If they can ride this wave, reinvest in the business, and push exports, this could be the start of serious, long-term growth—especially with India booming as a global clothing hub right now.
6. Conclusion
Uniroyal has got less debt, more cash, and their main label-making business is finally bringing in real money again. Their profit margins are thin, and a big chunk of their recent profit only happened because they sold off an asset—not because their everyday business boomed. Plus, if you look at the whole company, including their subsidiary, their overall revenue actually dropped.
They took a solid step forward last year, but to really be an attractive investment, management has to prove they can consistently grow sales and make money without relying on lucky, one-time windfalls.
.
Data Sources