UNDER ARMOUR, INC.
Executive Summary:
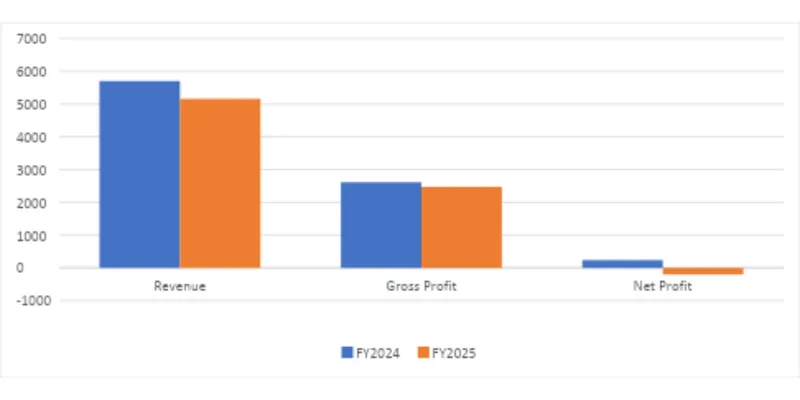
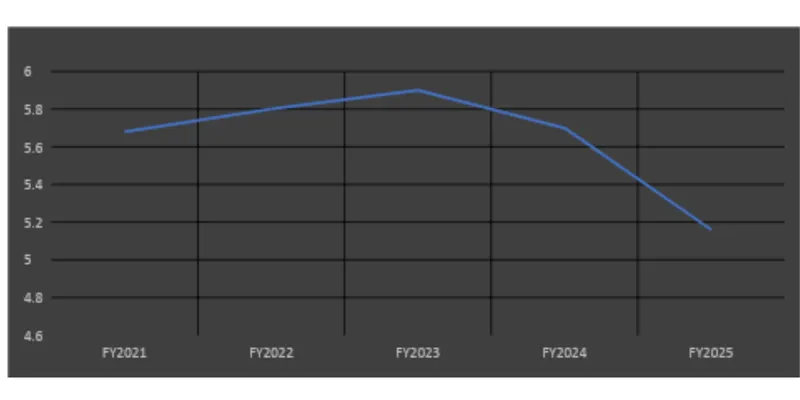
Due to weak consumer demand, intense competition and increased operating costs, Under Armour Inc. struggled in fiscal year 2025. In fiscal year 2025, the revenues and profits for Under Armour Inc.
Declined significantly as opposed to fiscal year 2024.
The Under Armour brand continued to work toward developing a stronger brand value, controlling its costs, and strengthening its online revenues and profitability. The company is currently going through some corporate restructuring efforts and working toward better product quality and a stronger fiscal year in the future. While Under Armour continues to develop and maintain its worldwide sportswear brand status, the profits are still not at acceptable levels.
Company Overview:

Under Armour, Inc. Is a sportswear and accessories brand, based in the U.S., and manufactured and sold in the U.S and all over the world through global distribution channels that include distributors and retail.
Headquartered in Baltimore, Md., the firm was conceived as the creator of the ideal moisture-wicking performance T-shirts for athletes.
They eventually expanded into sportswear and sports equipment apparel and footwear, for both competition and training workouts, providing world reach, fitness opportunities and the latest in innovative performance and comfortable athletic wear. The main products are: Sports footwear and apparel and Bags. Accessories, like, etc gloves, etc hats, etc.
Industry Overview:
Some of the top companies within this industry are Nike, Adidas, Puma and Under Armour. This industry is highly competitive, with companies having to develop product innovation, celebrity endorsements, environmentally friendly products and compete internationally. Although demand is continually growing, the company experiences difficulties as there is a high cost of materials, shifting fashion trends and intense rivalry within the industry.
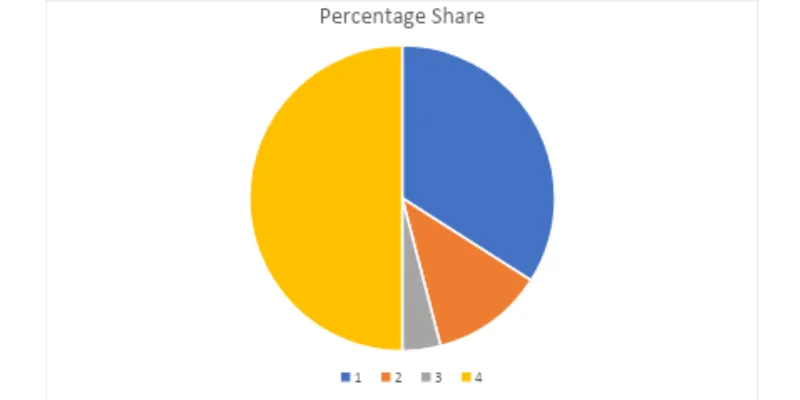
Pie chart of percentage share of segments:
Financial Performance (FY2025 VS FY2024):
Particulars | FY2025 | FY2024 |
|---|---|---|
Revenue | $3.00 Billion | $3.07 Billion |
Gross Profit | $1.32 Billion | $1.36 Billion |
Net Profit | $0.08 Billion | $0.17 Billion |
Key financial ratios:
Ratio | Formula | FY2025 Value | Interpretation |
|---|---|---|---|
Current Ratio | Current Assets / Current Liabilities | 2.0x | Good liquidity position |
Gross Margin % | Gross Profit / Revenue | 47.8% | Stable pricing strength |
Net Margin % | Net Profit / Revenue | 2.1% | Low profitability |
Debt-to-Equity | Total Debt / Shareholders’ Equity | 0.8x | Moderate debt level |
Inventory Turnover | Cost of Goods Sold / Avg Inventory | 3.3x | Average inventory movement |
Return on Equity (ROE) | Net Income / Shareholders’ Equity | 4.8% | Low shareholder return |
SWOT Analysis:
Strengths | Weaknesses |
|---|---|
Good global brand identity. Positive association with the athletes. Increasing trend in the online business. | Profits have dropped, the competition has become tough, and sales have dipped considerably in North America. |
Opportunities | Threats |
|---|---|
Fitness Industry on the rise: The Asia and Europe sectors are expanding in terms of the growth in the industry, and sales for the sector are increasing in the digital space; also, we have found that growth in the fitness industry on a global scale. | Increasing costs, trade tensions and intense competition in footwear with the dominant duopoly of Nike & Adidas. |
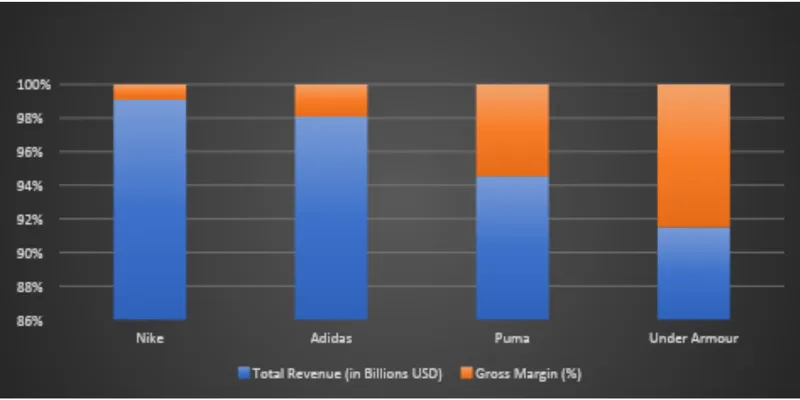
Peer Comparison:
Company | Revenue | Net Margin |
|---|---|---|
Under Armour | USD 5.16B | 2.1% |
Nike | USD 51.4B | 11.0% |
Adidas | USD 25.6B | 3.9% |
Puma | USD 9.5B | 3.5% |
Conclusion:
Although they have had poor financial results this year, they have the capacity to restructure, rebound and gain market share through their image, especially on the net and abroad.
References:
- Under Armour Investor Relations
- Visit the official site for Under Armour.
Financial data is obtained from the public market or annually reported.