Trisula International Tbk.

Executive Summary
Trisula International is an Indonesian integrated textile and apparel company. It was founded by Tirta Suherlan. The financial statement analysis of the firm demonstrates growth in the company's income, gross income, operating income, and net income in 2025. It is clear that the company remains well-liquid and properly geared and has improved profitability. The financial performance of the company depicts sound growth and profitability from the previous years.
Company Overview

Trisula International Tbk. is a stock-traded investment holding corporation located in Jakarta. It was established in 1968 by Tirta Suherlan. Its major concentration is in the textile, clothing, and garments sectors. These divisions consist of Manufacturing, Distribution, Uniforms, and Retail. It operates under the name of Trisula Corporation with more than 6,000 employees. In addition, it places high value on quality, innovation, sustainability, and corporate governance.
Industry Overview
The firm operates in the textile and clothing industry. This is one of the major manufacturing industries in the nation and an important exporter, employer, and generator of growth. The industry runs through various stages from fiber manufacture, spinning, weaving, dyeing, finishing, clothing manufacture, and fashion retail. The industry is driven by trends towards automation, manufacturing using information technology, and sustainability. But the industry is challenged by increasing costs of raw materials and tough global competition.
Financial Performance Analysis
Particulars | 2025 | 2024 |
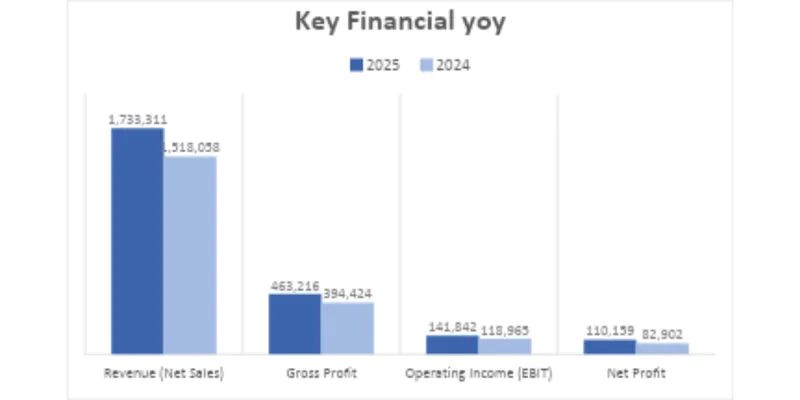
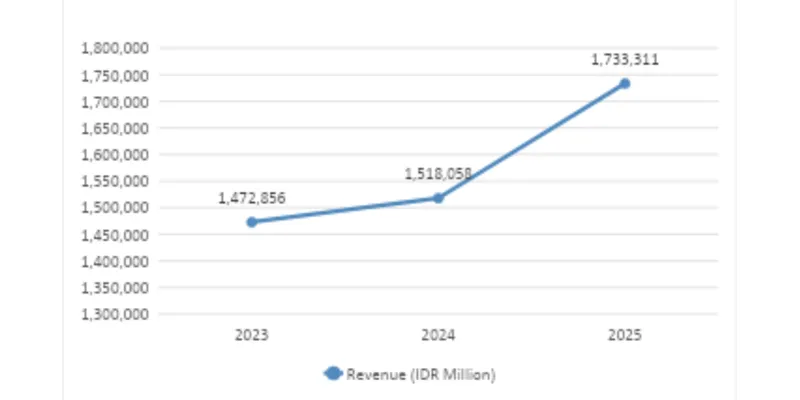
Revenue (Net Sales) | 1,733,311 | 1,518,058 |
Gross Profit | 463,216 | 394,424 |
Operating Income (EBIT) | 141,842 | 118,965 |
Net Profit | 110,159 | 82,902 |
4.1 Key Financial YOY
4.2 Revenue Trend Over 3-5 Years
4.3 Interpretation
The company reported a strong financial performance in 2025. Revenue increased in 2025, reflecting 14.2% growth. The increase in sales resulted to increased in gross profit. Operating income also increased, representing stronger operating performance. Net profit increased, showing an increase in overall profitability and earnings.
Key Financial Ratios
Ratio | Formula | 2025 | Brief Interpretation |
Return on Assets (ROA) | Net Profit / Total Assets × 100 | 8.10% | Indicates efficient use of assets to generate profits. |
Return on Equity (ROE) | Net Profit / Shareholders' Equity × 100 | 13.10% | Shows a strong return generated for shareholders. |
Net Profit Margin | Net Profit / Revenue × 100 | 6.36% | Reflects healthy profitability from sales. |
Current Ratio | Current Assets / Current Liabilities | 1.91x | Indicates good short-term liquidity and ability to meet current obligations. |
Cash Ratio | Cash & Cash Equivalents / Current Liabilities × 100 | 27.22% | Shows adequate cash available to cover immediate liabilities. |
Total Liabilities to Total Assets | Total Liabilities / Total Assets × 100 | 38.12% | Indicates a moderate reliance on debt to finance assets. |
Debt-to-Equity Ratio | Total Liabilities / Total Equity | 0.62x (61.60%) | Reflects a balanced capital structure with manageable debt levels. |
SWOT Analysis
Strengths | Weaknesses |
Vertically integrated operations from textiles to garments. | Smaller market share than large global textile companies. |
Healthy revenue growth and improving profitability. | Profit margins are affected by rising raw material costs. |
Strong relationships with domestic and export customers. | Limited financial flexibility due to moderate cash reserves. |
Opportunities | Threats |
Growing demand for sustainable and premium apparel. | Intense competition from low-cost manufacturing countries. |
Expansion into new international markets. | Fluctuations in exchange rates and raw material prices. |
Investment in automation to improve efficiency and reduce costs. | Global economic slowdowns may reduce export demand. |
Conclusion and Recommendations
Trisula International Tbk. Recorded strong revenue and profit growth in FY2025, reflecting improved operating performance and business expansion. The company maintained healthy liquidity, moderate leverage, and higher profitability during the year. Continued investment in automation, sustainable manufacturing, and export market expansion is recommended to strengthen its competitive position and support long-term growth.
References & Sources
- Trisula International Tbk. Annual Report 2025
- Trisula International Tbk. Official Website
- Microsoft Excel (Charts and Ratio Analysis)