TO UNDERSTAND THE FINANCIAL PERFORMANCE OF BENGAL TEA & FABRICS LTD

- Introduction
- Introduction of the company
Bengal Tea & Fabrics Ltd is an Indian company which deals in textile, tea plantation and limited real estate activities. The company operates its tea business mainly in Assam and West Bengal and previously been involved in fabric production through its textile division. Over the years, the firm has diversified revenue streams to balance the up and down revenue flows of the tea and textile industries.
The company is listed on Bombay stock exchange and operates as a small-cap diversified plantation and textile enterprise.
- Industry Overview
- Tea Industry - India is the second-largest producer of tea globally, with Assam and West Bengal being the maximum contributors. Talking about the company, The Tea division of the Company consisted of three tea estates having a total gross area of 777.38 hectares and a planted area of 626.15 hectares and total yearly production is about 1.4 million kgs. of Black Tea but with a total production capacity of around 2.4 million kgs. These are situated in North Lakhmipur in Upper Assam. The names of the three estates are as under:
- Ananda Tea Estate
- Pathalipam Tea Estate
- Bordeobam Tea Estate
- Textile Industry - The textile industry in India contributes majorly to:
- ~2–3% of GDP of India.
- ~12% of export revenue.
- Huge employment generation.
Still, patterns in this field shift over time due to multiple causes including: - Raw material price volatility
- Export market fluctuations
- Changes in global economic conditions and trade policies0
- Purpose of the Analysis
The main purpose of this study is to analyse the business operations and structure of Bengal Tea & Fabrics Ltd and to understand the financial performance of the company.
2. Company Overview
- Background and History
Before Bengal Tea & Fabrics Limited, the company was known as Bengal Tea Company Limited (BTCL). BTCL was started in 1950 and owned three tea estates in Assam. Ananda Assam Tea Co. Ltd. which had five tea estates located in Assam, was amalgamated with BTCL on 1st January, 1970.
In 1972, BTCL acquired Asarwa Mills (then having one textile mill at Ahmedabad) which then became its subsidiary. Asarwa Mills was then amalgamated with BTCL from 1st January, 1976. The company’s name was then changed to Bengal Tea & Fabrics Limited on 1st May, 1977.
- Business Model
The company operates through a multi-segment revenue model:
Segment | Revenue Source |
Tea Plantation | Cultivation and sale of tea through auction markets |
Textile Operations | Fabric manufacturing and processing |
Real Estate / Other Income | Earnings from land assets and investment income |
- Key Products / Services
The key products offered by the company are as follows- - Tea Plantations
- Processed tea sold in auction markets
- Fabric processing and textile manufacturing
- Income from real estate or asset monetization
- Market Position
The company comes under the category of small-cap plantation and textile companies with a market capitalization of 132 Cr.
Bengal Tea and Fabrics Ltd is not as large as other integrated companies in the industry, but it benefits from:
- Ownership of plantation land
- Low financial leverage
- Diversified asset base
However, decreasing revenue growth over the past few years reflects some difficulties in its operating segments.
3. Promoter /Founder Information
Promoters | Role in the Company |
M/s Rydak Enterprises & Investment Limited | Promoter Group |
Mr. Adarsh Kanoria | Promoter-Executive, Chairman & Managing Director |
Mrs. Shubha Kanoria | Chairperson, Non-Executive Director |
Mr. Kushagra Kanoria | Executive, Whole time Director |
Mr. Varenya Kanoria | Promoter |
4. Financial Statement Analysis
- Income Statement Analysis
Metric | FY2025 | FY2024 | FY2023 |
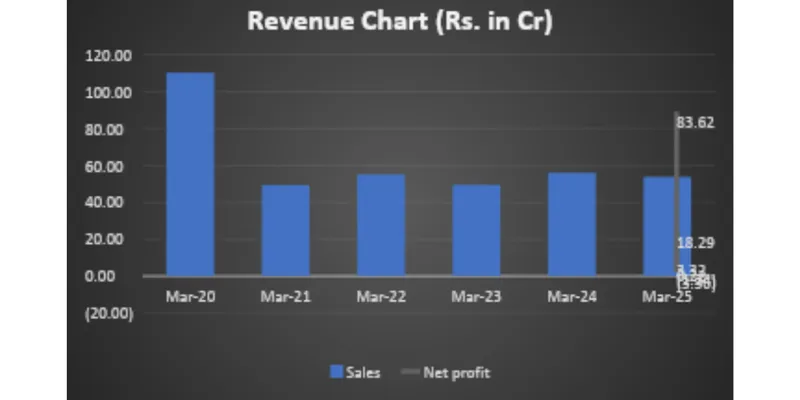
Net Sales Revenue | ₹53.73 Cr | ₹56.12 Cr | ₹49.52 Cr |
Net Profit After Tax | ₹83.62 Cr | ₹-3.36 Cr | ₹0.22 Cr |
Key Observations of Income Statement:
- In FY 2025, Revenue decreased by 4% approx.
- Net profit in FY 2025 in more than its sales due to exceptional items in other income
- Profit went up exponentially in FY 2023 due to exceptional items in other income.
- Revenue Chart
- Balance Sheet Analysis (Rs. In crore)
As of FY25:
- Other Liabilities: Went down significantly from previous year
- Investments: Increased by 19.5% from last year
- Other Assets: Reduced by 45% from previous year
- Cash Flow Statement Analysis (Rs. In crore)
Narration | Mar-21 | 21 Mar-22 | Mar-23 | Mar-24 | Mar-25 |
Cash from Operating Activity | 5.95 | 6.61 | 6.14 | 79.44 | 21.72 |
Cash from Investing Activity | -3.19 | 28.20 | -23.52 | -79.06 | -19.56 |
Cash from Financing Activity | -3.56 | -20.96 | 4.63 | -1.82 | -2.17 |
Net Cash Flow | -0.81 | 13.84 | -12.75 | -1.45 | -0.01 |
FY25 highlights:
- Operating cash flow went down significantly.
- Investing cash flow improved significantly from prior year but remained negative.
- Financing cash flows decreased from previous year
- Key Financial Ratios (Indicative)
Sl. | Key Financial Ratios | 2024-25 | 2023-24 | Difference (%) | Explanation |
1 | Inventory Turnover Ratio (times) | 11.86 | 4.31 | 175.26 | Inventory ratio improved due to lesser level of unsold stock. |
2 | Net Profit Ratio (times) | 1.56 | (0.06) | (2,698.64) | Main reason for high percentage of variance is due to execution of the disposal transactions relating to discontinued operations during the current financial year and the resultant profit thereon. |
3 | Return on Investment (ROI) | 7.09 | 10.73 | (33.86) | Returns were lower due to higher cost of investments because of changes in interest rates in the monetary policy. |
4 | Current Ratio (times) | 12.00 | 1.34 | 792.50 | Current ratio is higher during the financial year mainly on account of higher investments and crystallization of the sale of Discontinued Operations. |
5 | Debt Equity Ratio (times) | 0.06 | 0.06 | - | - |
- Year-on-Year Comparison (3 years)
- FY23: Revenue decreased by 5 Cr and Net Profit almost became zero.
- FY24: Sales increased but Net Profit turned negative.
- FY25: Revenue decreased by 2 CR but exponential increase in net profits due to exceptional items in other income categories.
5. Key Insights & Interpretation
- Strengths
- Strong asset holdings through plantation land and real estate holdings, which provides natural value despite moderate operating income.
- Less long-term debt ensures less interest burden and ensures financial stability even during weak profitability time.
- Weaknesses
- Declining revenue and profit numbers over the past few years
- Low asset turnover ratio, suggesting inefficient utilization of assets.
- Heavy dependence on unstable agricultural output and auction tea prices.
- Risk Factors
- Tea price instability due to global supply and demand factors.
- Rising labour costs in plantation work, which majorly affects margins.
- Weather-related risks which can destroy tea production in Assam and West Bengal.
- Future Outlook
The company’s future outlook depends on its skills to increase revenue growth and manage assets effectively. While the company has good financial stability due to low debt and enough reserves, continued profitability will be required to maintain the same.
If the management focuses on improving plantation practices, and tea production methods, and using unused assets for revenue generation, the company may gradually improve its profits. However, without strategic improvements in daily main operations, revenue growth could remain a long-term concern.
6. Conclusion
Final Evaluation of Financial Health
Bengal Tea & Fabrics Ltd shows strong financial stability due to its low debt and substantial asset base, but operational performance remains weak. Declining revenues and unstable profits highlight many inefficiencies within its business segments.
The balance sheet strength provides relief, but the company must improve their efficiency of daily operations and revenue growth to fully utilize its potential.
Investment / Performance Perspective
The company can be said as a small-cap company with more assets but less growth chances. The less leverage and land holdings provide some protection, but unstable earnings and declining revenues decreases its attractiveness as a growth investment.
Therefore, the company must improve its sales and profit numbers in order to be visible to investors and thrive in the industry.
Data Sources
https://www.screener.in/company/BENGALTEA