TO Analyse Financial Performance Of Suryalakshmi Cotton Mills Ltd.

1. Introduction
Started back in 1962, Suryalakshmi Cotton Mills Ltd took root in Telangana. From spinning to stitching, it handles many parts of making textiles. Cotton yarn comes first, then denim follows, later turning into full clothes. Even though the company stays grounded at home, buyers abroad keep orders moving - ships go out to places like Bangladesh and Ethiopia. Years pass, yet one thing holds: steady work in a changing fabric world.
Home demand pushes India’s textile industry forward, a giant player among global cloth producers. By 2030, its value may near $350 billion. Shifts in international sourcing, especially as buyers look beyond China, help fuel this rise. Yet price swings in raw materials bring stress. Other countries stepping up production also make things tougher.
Purpose of the analysis:
Looking at five years of verified figures reveals how the business has managed its money over
time. Performance trends emerge when examining income, spending, and debt year by year. Instead
of relying on estimates, real filings show whether growth is steady or uneven. Risks become clearer through patterns in cash flow and obligations. Investment value depends less on hype, more on consistent results across multiple seasons.
2. Company Overview
Background and history:
From its beginnings in 1962 as a trade-focused business, it gradually grew beyond commerce. Over time, production became central - spinning units emerged, then denim operations followed. Certification under ISO standards now marks its operational baseline. Official designation names it a Government Export House, reflecting consistent international output.
Business model:
Fabric made in-house, starting from thread through to finished jeans, cutting expenses while keeping standards steady. About three-fourths of income comes from home market, the rest from overseas sales by fiscal year 2025.
Key products/services:
- Cotton/blended yarns
- denim fabrics
- ready garments.
Market position:
A company of moderate size operates within the jeans market, holding steady ownership by promoters at about 61 percent. Though up against bigger rivals, it holds its ground through focused expertise in eco-friendly denim production.
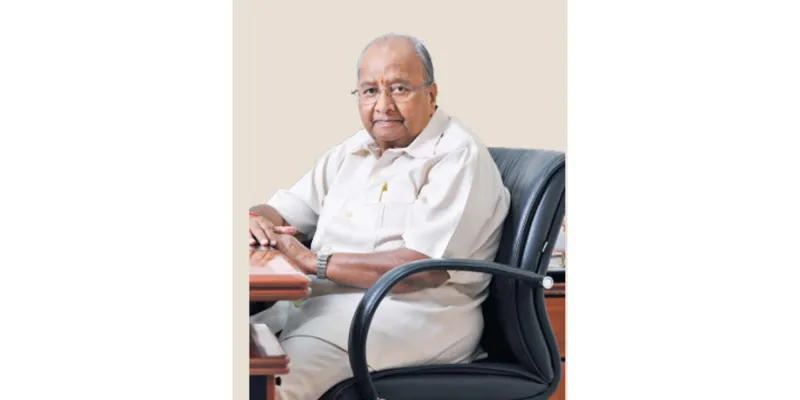
3. Promoter / Founder Introduction
Name:- Sri Lakshmi Narayan (L N) Agarwal(Founder, Chairman & Managing Director)
Professional background:-
After completing studies at the University of Nagru, he began working as a cloth trader in 1962 - ethical principles guiding each step while growing the business across fifty years. Paritosh K Agarwal, his son and now Managing Director, stepped into the role following university, taking charge of daily activities through gradual involvement rather than sudden shift.
Role in growth:-
A shift in direction came through L N Agarwal’s long-term outlook, moving operations beyond trade into full-scale production. Because of deliberate choices like increasing output capability alongside environmental responsibility, financial performance began rising again after a downturn following FY21.
4. Financial Statement Analysis (₹ Cr, Standalone)
Income Statement Analysis (FY22–FY25):-
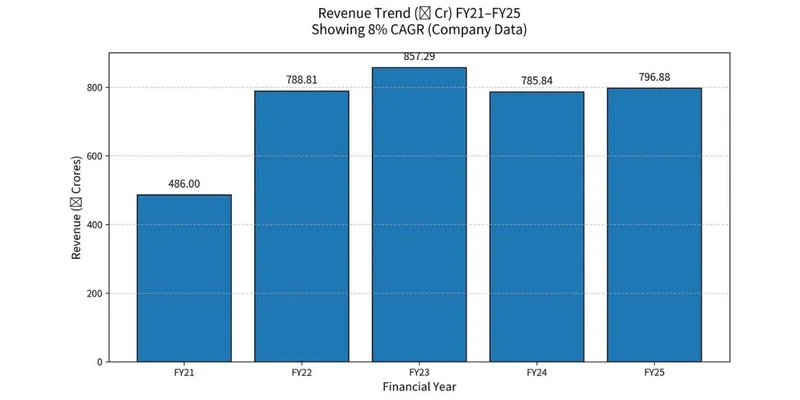
FY21 revenue 486:- Revenue grew at ~8%
CAGR:
- FY22: 778
- → FY23: 851 (zenith)
- → FY24: 782
- → FY25: 792.
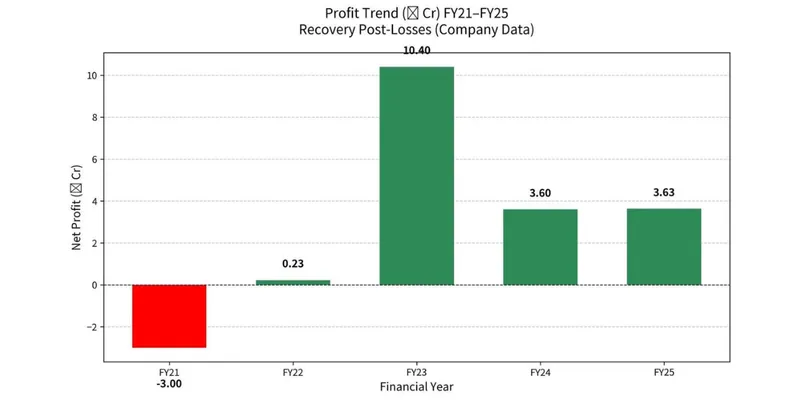
Net Profit turned positive:
- FY21 (-3)
- FY22 (0)
- FY23 (10)
- FY24 (4)
- FY25 (4)
EBITDA margins declined from ~10% (FY22) to ~6% (FY25) due to cost pressures.
Balance Sheet Analysis:-
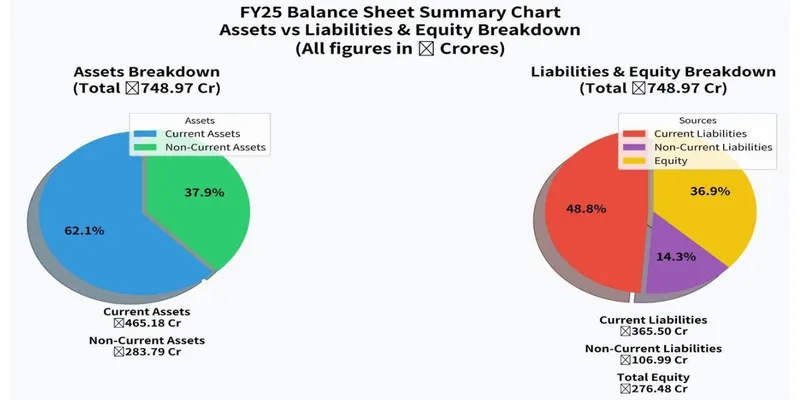
- Total Assets stable at ~650–750: FY21: 688 → FY25: 749.
- Equity grew modestly (230 → 266).
- Current Assets rose to 465 (FY25).
- Liabilities include borrowings ~287 (FY25).
- Total Liabilities & Equity balanced at 749.
Cash Flow Statement Analysis:-
- Net Change in Cash fluctuated: +5.81 (FY21) ---→ -2.66 (FY22)----→ -0.71 (FY23) ---→ -6.10 (FY24) ---→ +0.68 (FY25).
- Changes in Working Capital volatile (high inventory days ~154 in FY25). Capex increased (higher in FY24–25).
- Free Cash Flow positive early, then negative.
Key Financial Ratios:-
- Profitability:{ Net Margin ~0.5%, ROE 1%, ROCE 7% (declining trend) }
- A small net margin sits around half a percent. One percent shows up in return on equity. Return on capital employed stands at seven percent yet slips over time.
- Liquidity:{ Current Ratio ~1.27 (adequate but tight) }.
- A little above one point two seven - this current ratio holds steady, yet leaves little room. Tight, though enough for now.
- Leverage: {Debt/Equity moderate; no defaults.}
-Some borrowing mixed with owner funds. Payments always made on time.
- Efficiency: {High Cash Conversion Cycle (139 days) indicates working capital pressure.}
- That long cash conversion cycle - 139 days - slows things down. Working capital gets tight when money sits stuck that long.
Year-on-Year Comparison:-
Following a high point in FY23, revenue settled into a steady pattern. Although profit levels have improved, they still hover near minimal margins. Investment priorities show in sustained capital spending, while asset and equity figures hold firm. Stability defines the financial stance, despite narrow earnings returns.
Profit Trend Chart:-
5. Key Insights & Interpretation
Strengths:
Backward control across production steps marks the setup. Ownership remains steady, with a key backer retaining 61%. Expansion seen in holdings during the period. International delivery networks extend further each quarter. A clear rebound took place by fiscal year 2023.
Weaknesses:
Facing narrow profit margins alongside weak return on equity and capital efficiency lately. Inventory sits longer than ideal, stretching operational cycles unexpectedly. Cash generation falters despite ongoing activity across quarters recently.
Risk factors:
Unpredictable cotton prices alongside rising energy and wage expenses create pressure. Competition adds further strain on margins. The working capital period stretches longer than ideal. Liabilities tied to uncertain events amount to about 59 crore.
Future outlook:
Looking ahead, a commitment to sustainability - captured by "Innovating today, Sustaining tomorrow" - shapes strategy amid steady appetite for denim. Growth in income likely stays limited. Success turns largely on how tightly expenses are managed.
6. Conclusion
Moderate financial condition marks Suryalakshmi Cotton Mills Ltd, with a balanced sheet holding firm through recent years. Revenue holds up despite external shocks, profits have climbed since pandemic lows - yet returns remain thin. Operational efficiency drags on results, limiting momentum. For those focused on undervalued opportunities, the stock may appeal, especially if accepting sector-specific swings. Watch cash tied up in operations, along with margin trends, closely. Growth stays flat, avoiding sharp declines without notable expansion. Dividends are absent entirely, offering zero yield at present.
Data Sources:
- Screener.in
- Integrated Annual Report 2024-25 (www.suryalakshmi.com)
- official filings (NSE/BSE).