To analyse financial performance of EAST SILK INDUSTRIES LTD.

INTRODUCTION
- Brief Introduction of the company
Eastern Silk Industries Limited (ESIL) was established in the year 1946, and it is a leading manufacturer and exporter of silk products with its headquarters in Bengaluru/Kolkata. They deal in luxury silk fabrics, yarn, home decoration, scarves, and accessories, to both domestic and international clients. The company is oriented at the superior craftwork, creative design, and sustainable solutions in textile.
- Industry Overview
The Indian textile and apparel industry is significant at global as well as at country level. This industry produces employment and economic growth in the country. This industry has a very great future because of increasing demand in textile and fashionable products. However, this industry faces many challenges like raw material price fluctuation, global competition, and change in demand.
- Purpose of the Analysis
This research and analysis will help to understand the financial condition of EAST SILK INDUSTRIES Ltd. Also this analysis will help to know more about the company and about the Textile industry. The analysis will cover all companies’ profit and loss statements, balance sheets and key financial ratios.
COMPANY OVERVIEW
- Background and History
Eastern Silk Industries Limited (also known as Eastern Silk or ESIL) is a major Indian manufacturer and exporter of silk products, which was founded in 1946, and is headquartered in Kolkata, West Bengal. The company focuses on the full chain of the silk business such as silk yarn, fabrics, made-ups, home furnishings, and fashion accessories such as scarves and embroidered fabrics.
- Business model
The company follow Trading-business model –
- Producing Textile Products.
- Developing premium fabric.
- Trading activity with global partners.
- Key Product and Services
- Silk Fabric.
- Home Furnishing.
- Fashion Fabric
- Handel Room Fabric.
- Market Positioning
The company is globally recognised for its expensive silk fabric, Home Furnishing, fashion fabric. It comes under mid-size in the textile industry. By operating in domestic as well as international markets.
PROMOTERS / FOUNDER
Name | Designation | Professional background | Role in company |
Mr. Ajay Bikram Singh | Chairman | Textile industry experience | Strategic management |
Ms. Jyoti Thomas | Managing Director | Business management | Operations |
Mr. Praveen Kumar Agarwal | Non-Executive Director | Corporate governance | Board oversight |
FINANCIAL ANALYSIS
- Income statement analysis
Particular | FY2025 | FY2024 |
Income from operation | 21.58 | 18.77 |
Total Expenses | 22.90 | 29.19 |
Profit Before Tax | 0.53 | (11.87) |
Net Profit / Loss | 3.96 | (12.30) |
(In Cr.)
Key Observations of Income Statement:
1) There is improvement in income from sales i.e. 21.58 Cr.
2) Net profit has converted from negative to positive (-12.30 Cr. to 3.96 Cr.)
- Balance sheet analysis
Particular | FY2025 | FY2024 |
Equity share capital | 15.79 | 15.79 |
Total Current Assets | 114.33 | 97.64 |
Total Current Liability | 27.13 | 14.56 |
Total (End of FY) | 150.51 | 135.36 |
(In Cr.)
End of the FY25 –
1) Equity share capital – There is no change in Equity share capital.
2) Current Assets- The current assets in FY25 is increased as compare to FY24 by 17%
3) Current Liability-The current liability also increased to 27.13 Cr. From 14.56 Cr. In FY25.
- Cash Flow Statement
(In Cr.)
Cash / FY | FY2025 | FY2024 |
Operating | (1) | 7.46 |
Investing | (4.30) | (0.41) |
Financing | 2.96 | (5.97) |
Cash and Cash Equivalent (End) | (2.34) | 1.08 |
Note –
- Cash from operating and investing activity are negative because of operating expenses and repayment of loan.
- Cash from financing activity is positive which indicates sell off assets of interest received on loan.
Key financial Ratio
- Profitability Ratio
ROE - Net profit / shareholder equity *100 = 6.37 %
- Liquidity Ratio
Current Ratio – current assets / current liability = 0.95
- Leverage Ratio
Debt to Equity Ratio – Total Debt / Shareholder equity = 0.98
- Efficiency Ratio
Net Profit Ratio – NPAT / Net Sale = 18 %
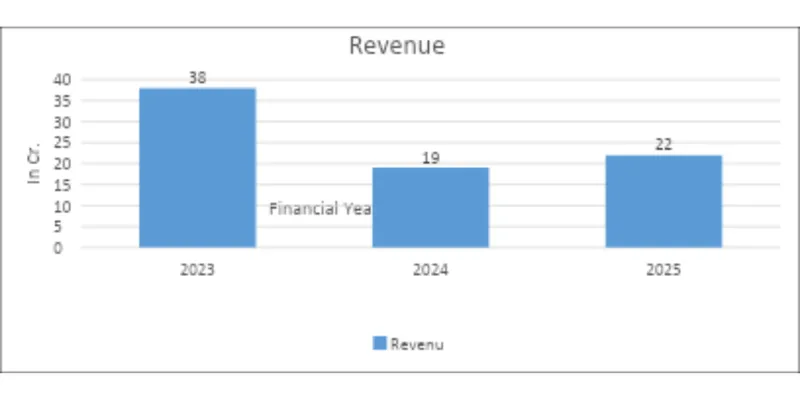
- Year on year comparison ( 3 years revenue)
5. KEY INSIGHTS AND INTERPRETATION
- Strengths
1) Management having a deep experience in the textile and finance sector.
2) Successful exit from CIRP process and immediately return to net profit.
3) Strong recognition in the international silk industry.
- Weakness
1) Current ratio below 1 indicates tight working capital management.
2) Multiple production factories are in non-operational condition.
- Risk factor
1) There is material uncertainty in the silk industry.
2) Big no of competition in market and continuing change in trends.
- Future Outlook
The company is in a recovery phase where it is improving revenue year by year. The company plans to invest in new machinery and technology to reduce production cost and improve profitability. They can focus more on reducing debt to long term growth.
CONCLUSION
Final evaluation of financial condition
Eastern Silk Industries is in a shaky yet recovering financial position. The possibility to change to a positive net profit is significant, but liquidity is a question because the company is still in the process of restructuring.
Investment / Performance Perceptive
This is a high-risk, high-potential turnaround opportunity of the company. The future improvement will be solely based on the effective repayment of the remaining tranche of resolutions, as well as the complete functionality of its manufacturing facilities.
Sources
https://www.screener.in/company/EASTSILK/