To analyse financial performance of Callista Industry Ltd. (CHPL Industry Ltd.)

INTRODUCTION
- Brief Introduction of the company
Callista Industry Ltd. previously known as CHPL Industry Limited. It is an Indian company mainly operating in manufacturing and trading activity. The company gradually expanded their business and operational activity in the packaging sector. The company is in the developing stage and more focusing on improvement in profitability.
- Industry Overview
The Indian textile and apparel industry is significant at global as well as at country level. This industry generates employment and improves the country's GDP. This industry has a very great future because of increasing demand in textile and fashionable products. However, this industry faces many challenges like raw material price fluctuation, global competition, and change in demand.
- Purpose of the Analysis
This research and analysis will help to understand the financial condition of Callista Industry Ltd. (CHPL Industry Ltd) also this analysis will help to know more about the company and about the Textile industry. The analysis will cover all companies’ profit and loss statements, balance sheets and key financial ratios.
COMPANY OVERVIEW
- Background and History
Callista Industry Ltd. was earlier known as CHPL Industry Ltd. incorporated in 1989. The company changes their name as a part of strategic development and expansion plans. Over the time the company attempted to expand and diversify business activity. Primarily engaged in trading textile, fabric, and general merchandise. Later the company focused on the packaging material industry for expansion.
- Business model
The company follow Trading-business model –
1) Manufacturing and trading of textile products.
2) Also focusing on the flexible packaging sector.
3) Expanding into diversified services in the textile industry.
- Key Product and Services
1) Manufacturing operation
2) Trading of goods and materials
3) Providing flexible packaging solution
- Market Positioning
In the past, Callista Industry Ltd. were relatively small players in the industry. The company initially focused on manufacturing and trading of textile products. Later the company focused on expanding in the flexible packaging industry. The company wants to position themselves in a diversified market.
PROMOTERS / FOUNDER
Name | Designation | Professional background | Role in company |
Mrs. Rashmi Ravi Sharma | Managing Director | Experience in corporate management and business administration. | Look for overall management, strategic making and implementation of strategy... |
Mr. Ravi Sharma | Promoter | Work experience in Textile Industry | Holding Substantial equity share. |
FINANCIAL ANALYSIS
- Income statement analysis
Particular | FY2025 | FY2024 |
Income from operation | 0.00 | 0.00 |
Total Expenses | 0.63 | 0.15 |
Profit Before Tax | (0.63) | (0.15) |
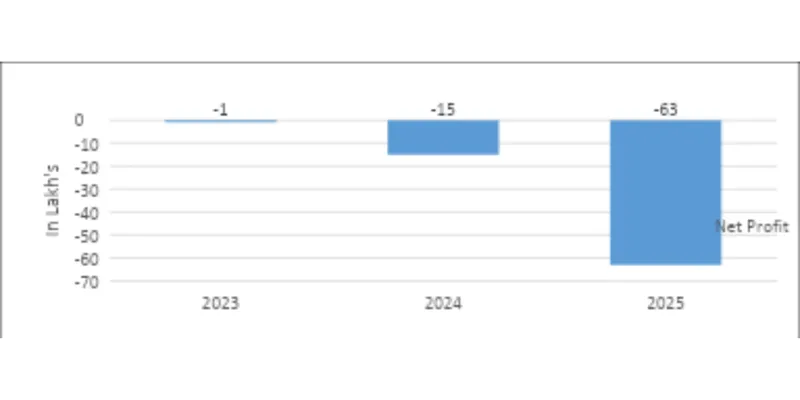
Net Profit / Loss | (0.63) | (0.15) |
(In Cores)
Key Observations of Income Statement:
1) The company didn’t generate any revenue from operations.
2) The company consumes net loss in the Financial Year 2025.
- Balance sheet analysis
Particular | FY2025 | FY2024 |
Equity share capital | 3.05 | 3.05 |
Total Current Assets | 0.20 | 0.20 |
Total Current Liability | 0.15 | 0.13 |
Total ( End of FY) | 0.74 | 0.74 |
(In Cores)
End of the FY25 –
1) Equity share capital: There is no change in equity share capital.
2) Total Current Assets: FY25 current assets are the same as compared to FY24.
i.e. 0.20 Cr.
3) Total Current liability: Current Liability is increased in FY25 i.e.0.15 Cr.
- Cash Flow Statement
(In Cores)
Cash / FY | FY2025 | FY2024 |
Operating | (0.63) | (0.13) |
Investing | 0.00 | 0.00 |
Financing | 0.77 | 0.13 |
Cash and Cash Equivalent (In the end ) | 0.0039 | 0.0024 |
Note –
1) Cash from operating is negative because of loss during the year.
2) Financing activity is generating cash flow during the year, that show company
Is gaining income from financial activity.
Key financial Ratio
- Profitability Ratio
Return on Equity Ratio = 0.81
- Liquidity Ratio
Current Ratio = 1.33
- Leverage Ratio
Debt to Equity Ratio = (1.77)
- Efficiency Ratio
Earnings per Share = (2.07)
- Year on year comparison ( 3 years revenue)
5. KEY INSIGHTS AND INTERPRETATION
- Strengths
1) Stable equity share capital
2) Management efforts to expand into new business areas
3) Compliance with regulatory and financial reporting standards
- Weakness
1) Lack of revenue in this financial year.
2) Weak financial position due to loss in the financial year.
- Risk factor
1) Financial risk due to negative profitability.
2) Dependence on successful implementation of new business strategies
- Future Outlook
The company is facing very bad financial performance in FY25. The company will be dependent on a successful expansion plan in the packaging sector. If a company is able to improve operational efficiency, sales and generate stable revenue then only the company may stabilize their financial position.
6. CONCLUSION
Final evaluation of financial condition
Based on the research and financial analysis Callista Industry Ltd. is currently in a bad financial position and facing many challenges in the market. The company has faced huge losses in the financial market. To improve and turnover their financial position they are expanding in the packaging sector.
Investment / Performance Perceptive
From an investor perspective, the company is currently in a bad financial position, because of that investor may think about risk in investment. If companies improve and implement new strategies that can change their financial performance then investors can think about investing.
Sources
https://callistaindustries.com/
https://www.screener.in/company/539335/
https://www.businesstoday.in/stocks/callista-industries-ltd-share-price-366111