To analyse financial performance of AREX INDUSTRIES LTD.
INTRODUCTION
- Brief Introduction of the company
Arex Industries Ltd. is a manufacturing company situated in Gujarat that produces branding solutions and woven textile labels. The business serves sectors where labelling is essential to product identity, such as clothing, packaging, and branding. Since then, it has served as a vital supplement to the clothing sector, creating labels that enhance consumer perceptions of brands.
- Industry Overview
The Indian textile and apparel industry is significant at global as well as at country level. This industry produces employment and economic growth in the country. This industry has a very great future because of increasing demand in textile and fashionable products. However, this industry faces many challenges like raw material price fluctuation, global competition, and change in demand.
- Purpose of the Analysis
This research and analysis will help to understand the financial condition of AREX INDUSTRIES LTD. Also this analysis will help to know more about the company and about the Textile industry. The analysis will cover all companies’ profit and loss statements, balance sheets and key financial ratios.
COMPANY OVERVIEW
- Background and History
August 1992 marked the start of the company's commercial label manufacturing output. It has served as a vital supplement to the clothing industry ever since. The business serves sectors where labelling is essential to product identity, such as clothing, packaging, and branding. The business exports woven and printed labels to foreign markets.
- Business model
The company follow business Activity/ Model –
1) Manufacturing apparel and garments.
2) Selling in the domestic and international market.
3) Exporting of labelling products.
- Key Product and Services
1) Woven Labels
2) Printed Labels
3) Packaging and labelling materials.
4) Branding Accessories.
- Market Positioning
Arex is a mature competitor in a very fragmented industry where many organized and unorganized players are present thus price competition is high. An established medium-sized player with specialization in high volume, cost-effective labelling equipment, usually playing a key role as a supplier to local FMCG, pharmaceutical and retail industries.
PROMOTERS / FOUNDER
Name | Designation | Professional background | Role in company |
Mr. Dinesh A. Bilgi | Managing Director & CFO | Textile Engineer (B.Tech), 50+ years’ experience | Strategic leadership & finance |
Mr. Neel D. Bilgi | Managing Director | MBA (Marketing) | Sales & marketing |
Mr. Chirag D. Bilgi | Managing Director | BBA (Marketing) | Production & technical |
FINANCIAL ANALYSIS
- Income statement analysis
(In Cr.)
Particular | FY2025 | FY2024 |
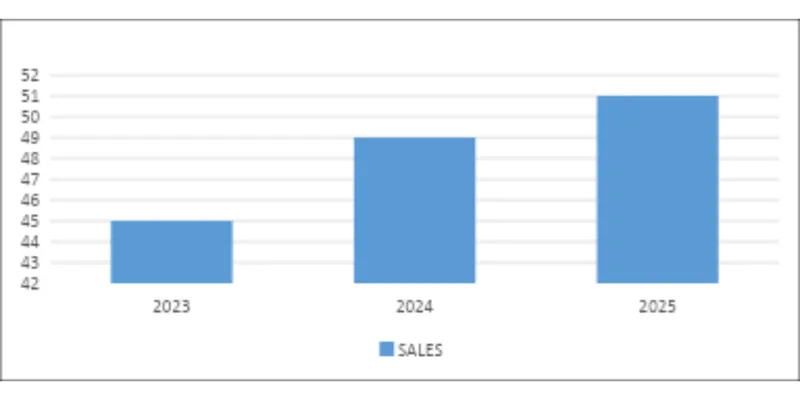
Income from Operation | 51.14 | 51.01 |
Total Expenses | 48.17 | 47.41 |
Profit Before Tax | 3.67 | 3.69 |
Net Profit | 2.63 | 2.54 |
Key Observations of Income Statement:
1) Revenue increased in FY25 by 0.25%. i.e. 51.14 Cr.
2) Net Profit for FY25 increased as compared to FY24.
- Balance sheet analysis
Particular | FY2025 | FY2024 |
Equity Share Capital | 3.60 | 3.96 |
Total Current Assets | 17.87 | 18.84 |
Total Current Liability | 13.58 | 9.71 |
Total Assets (End of FY) | 46.62 | 50.16 |
(In Cr.)
End of the FY25 –
1) Equity share capital reduced to 3.60 lakhs due to buyback of share at rs.195
2) Total current assets decreased in FY25 as compared to FY24 i.e. 17.87
3) Total current liability increased in FY25 because of increased short term borrowing.
- Cash Flow Statement
(In Cr.)
Cash / FY | FY2025 | FY2024 |
Operating | 8.91 | 9.50 |
Investing | -0.79 | -0.94 |
Financing | -8.09 | -8.59 |
Cash and Cash Equivalent (End) | 0.045 | 0.021 |
Note –
1) Cash from operating activity is positive but decreased as compared to FY24.
2) Cash from Investing and financing activity is in negative because company used
Around 71.23 lakhs for technology upgradation.
Key financial Ratio
- Profitability Ratio
ROE - Net profit / shareholder equity *100 = 9%
- Liquidity Ratio
Current Ratio – current assets / current liability = 1.32
- Leverage Ratio
Debt to Equity Ratio – Total Debt / Shareholder equity = 0.48
- Efficiency Ratio
Trade Receivable Ratio – 5.80
- Year on year comparison ( 3 years revenue)
5. KEY INSIGHTS AND INTERPRETATION
- Strengths
1) Huge increase in export revenue.
2) Steady growth rate in recent years.
3) Large industry experience management.
- Weakness
1) Declining profitability because of high operational expenses.
2) ROE and profitability ratio are low.
- Risk factor
1) Small market presence as compared to large industry leaders.
2) Rising labour and operational costs can reduce profits in the future.
- Future Outlook
The future of AREX Industries Ltd. is dependent on companies’ ability to improve efficiency and expand operations. If companies improve their operational efficiency, they may be able to improve their profitability. There is high demand in the international market for textile products where a huge market can be covered by business in future.
6. CONCLUSION
Final evaluation of financial condition
Arex Industries Ltd. is a mid-textile company with stable but limited growth performance. The company maintains consistent revenue and profit over the years but growth is slow and margins are under pressure due to rising costs. The company is financially stable and lacks strong growth drivers and high investment with high return.
Investment / Performance Perceptive
According to investor perception, the company has low financial risk with low ROE. The company has low potential growth that is why limited capital appreciation. But the company has earned consistently that plus points from an investment perspective.
Sources
https://www.screener.in/company/526851/