TJX Companies
Executive Summary
TJX Companies, Inc. Is the world’s largest off-price retailer of clothing and home-related products. The company has brands that include well-known names like T.J.
Maxx, Marshalls, HomeGoods, Home sense, Sierra, TK Maxx and Winners.
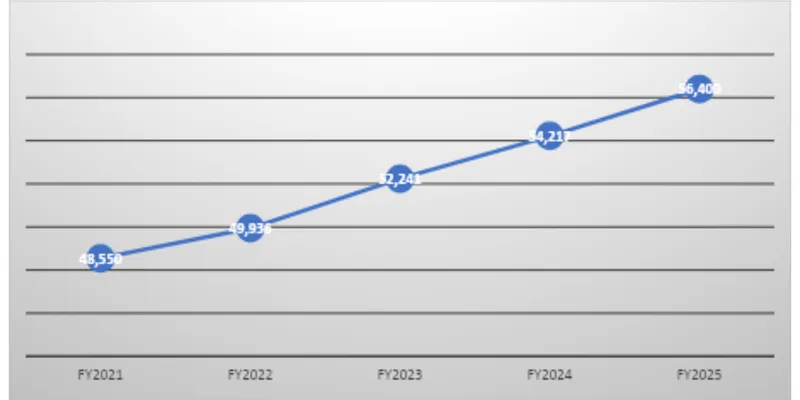
TJX Companies' business model concept relies on selling the most recognisable brand names at 20% to 60% below traditional department store or speciality store prices. So far, TJX Companies, Inc. Is performing great this FY25 with rising customer demand, boosted revenue, strong supply chain management and international development. In FY25, TJX’s revenue increased from $54.2 billion in FY24 to $56.4 billion in FY25 for a total of a 4.1% increase.
Company Overview

TJX CEO is Ernie Herrman.
TJX Companies, Inc. is an apparel and home decor retailer based in Framingham, MA.
Founded in 1976. The Company has over 5,100 locations in the U.S., Canada, Europe and Australia. We purchase and sell brand-name merchandise that ranges from clothes, shoes, accessories and beauty products to home decor. TJX has TJX brand retailers, namely T.J. Maxx, Marshalls, HomeGoods, Home Sense, Sierra, TJ Maxx and Winners.
Industry Overview
The global off-price retail industry continued its growth path in FY2025, owing to increasing inclination of consumers towards value propositions, due to economic uncertainties and inflation. The off-price industry benefited from increased branded inventory with manufacturers and changes in shopping preferences of consumers. There were substantial investments made by the key players in this industry towards logistics optimisation, inventory sourcing, digitalisation, and expansion of stores. The global apparel retail market size crossed USD 1.9 Trillion in 2025.
Financial Performance Analysis
Financial Summary Table
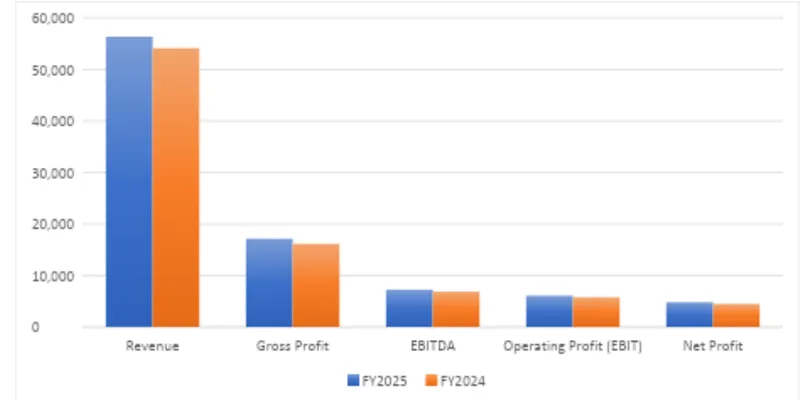
Financial Metric | FY2025 | FY2024 | YoY Change |
|---|---|---|---|
Revenue | 56,400 | 54,217 | +4.0% |
Gross Profit | 17,150 | 16,120 | +6.4% |
EBITDA | 7,250 | 6,870 | +5.5% |
Operating Profit (EBIT) | 6,090 | 5,760 | +5.7% |
Net Profit | 4,800 | 4,470 | +7.4% |
Revenue Trend Data
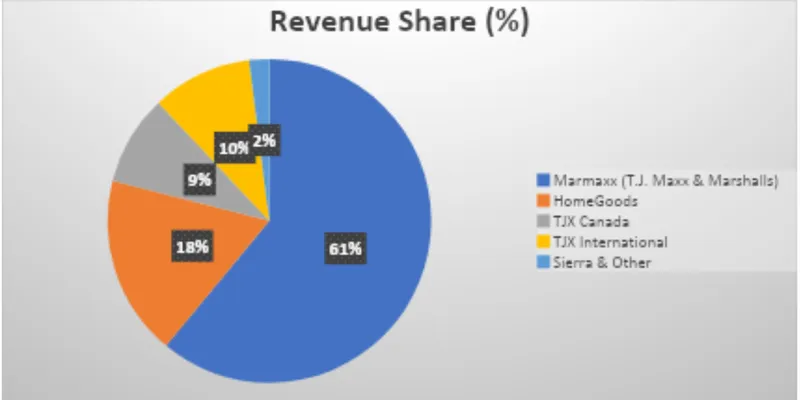
Revenue Segment Breakdown
Key Financial Ratios
Ratio | Formula | FY2025 Value |
|---|---|---|
Current Ratio | Current AssetsCurrent Liabilities | 1.18 |
Quick Ratio | Quick AssetsCurrent Liabilities | 0.55 |
Gross Margin | Gross ProfitRevenue | 30.4% |
Net Margin | Net ProfitRevenue | 8.5% |
Return on Equity (ROE) | Net IncomeEquity | 58.4% |
Debt-to-Equity | Total DebtEquity | 1.05 |
Interest Coverage | EBITInterest Expense | 13.8 |
Inventory Turnover | COGSInventory | 5.6x |
Asset Turnover | RevenueTotal Assets | 2.10x |
SWOT Analysis
Strengths | Weaknesses |
|---|---|
Global leader in off-price retail | Limited e-commerce presence |
Strong vendor relationships | Dependence on branded inventory availability |
Efficient inventory turnover | Mostly concentrated in developed markets |
Opportunities | Threats |
|---|---|
International expansion | Increasing competition |
Store network growth | Inflation and supply-chain disruptions |
Digital and omnichannel investments | Consumer spending slowdown |
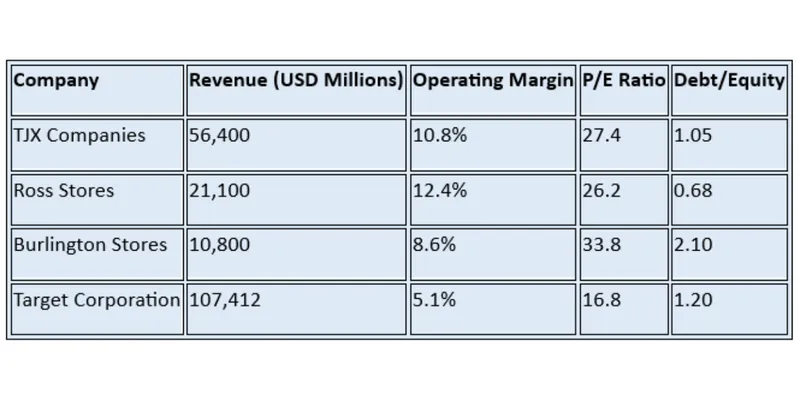
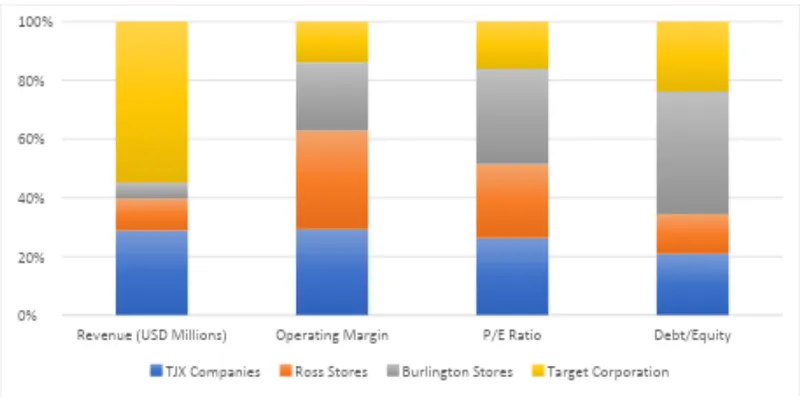
Peer / Competitor Comparison
Conclusion
FY2025 for TJX Companies: Another terrific year for sales and earnings. Revenue increased again, operating margins were wider, and profitability was higher once again. TJX’s business model as a “value retailer” resonates even more as value-conscious consumers look for bargains during a period of economic uncertainty.
A fortress balance sheet and solid inventory controls, plus its expansion abroad, should continue to drive long-term value.
References & Sources
1. TJX Companies Annual Report FY2025
2. TJX Investor Relations
3. Reuters Retail Industry Reports 2025
4. Bloomberg Financial Database
5. Statista Global Apparel Market Report 2025
6. NYSE Company Filings
Data Sources Used
- TJX Annual Report FY2025
- TJX Investor Presentation
- Reuters Financial Updates
- Bloomberg Industry
- Data Statista
- Retail Market Data