Titan Company Limited
1. Introduction
Titan Company Limited (stock code: TITAN, listed on BSE/NSE) stands among India’s top lifestyle firms. Well recognized for timepieces and signature jewellery, it has built a strong reputation through brands like Tanishq. Though shaped by homegrown preferences, every design connects practicality with shared meaning.
Under its own brand names, Titan creates goods in jewellery, timepieces, and optical wear.
The purpose of this analysis is to study Titan’s financials over FY23–FY25 using Screener-in and company filings. Written clearly, the explanation fits someone new to such tasks.
2. Company Overview
Background and history
A new company emerged in 1984 under the name Titan Watches Limited. This venture grew out of joint efforts between the Tata Group and TIDCO. The name changed later, reflecting growth beyond just watches. By 1994, a shift occurred when the firm stepped into fine jewellery via Tanishq.
Today, Titan Company Limited carries its present identity across BSE and NSE listings. More than 2,000 stores now dot India's landscape.
Business model
Titan’s business model is branded, multi-channel retail.
Most income arrives via physical shops run by the brand or partners, while online transactions add a steady share.
Gold enters Titan's process through open-market purchases, followed by crafting into jewellery sold directly to buyers at a higher price.
Key products and services
Titan’s main offerings fall into a few big categories:
Jewellery—including Tanishq, Mia, Rivaah—offers pieces made of gold and diamonds.
Brands such as Titan, Fastrack, and Sonata often prioritize visual style alongside utility.
Titan EyePlus offers glasses made to order along with sun protection styles.
Fashion accessories and scents include items such as bags, wallets, perfumes, and everyday carry goods.
Market position
With over 80% of its income traced to jewellery, Titan stands as India's top-value branded jeweller. Tanishq captures a strong portion of the formal jewellery sector.
Titan ranks high globally as a maker of branded timepieces.
3. Promoter / Founder Introduction
Titan Company Limited belongs to the Tata group. Ownership rests largely with Tata Sons Private Limited, which holds approximately 53 percent of shares.
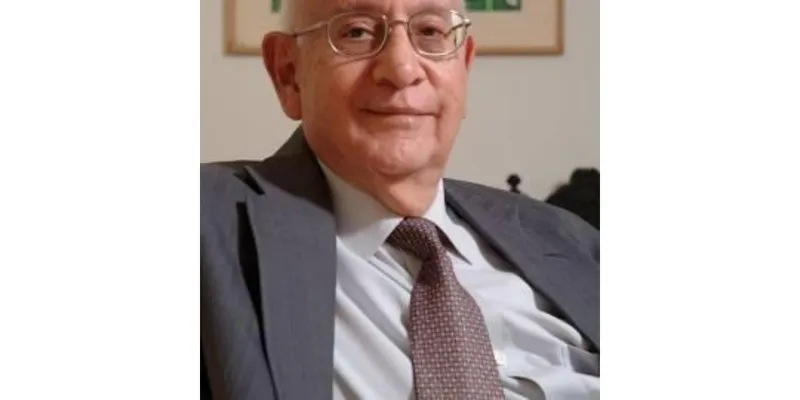
Starting out under his leadership, Xerxes Desai shaped Titan Company Limited from the beginning when it launched in 1984. Backed by both the Tata Group and TIDCO, the company emerged through a partnership that he guided into place.
4. Financial Statement Analysis
4.1 Income Statement Analysis
Titan’s revenue has grown strongly over FY23–FY25, driven mainly by jewellery. Net profit has also increased, though at a slightly slower pace than revenue.
Table 1: Income Statement – FY23 to FY25 (approx., in Rs. Crore)
Particular (Rs. Crore) | FY23 (approx.) | FY24 (approx.) | FY25 (approx.) |
|---|---|---|---|
Revenue from operations | 38,367 | 46,968 | 57,818 |
Operating Profit | 5,000 | 5,200 | 5,488 |
OPM % (approx.) | 13% | 11% | 10% |
Net Profit (PAT) | 3,200 | 3,500 | 3,800 |
EPS (approx. Rs.) | 25–26 | 28–29 | 30–31 |
Source: Screener.in, Titan FY25 annual report
4.2 Balance Sheet Analysis
Titan’s equity reflects consistent reinvestment of profits. Borrowings increased slightly to support expansions. Total assets climbed with revenue growth.
Table 2: Balance Sheet Summary – FY23 to FY25 (approx., in Rs. Crore)
Particular (Rs. Crore) | FY23 (approx.) | FY24 (approx.) | FY25 (approx.) |
|---|---|---|---|
Equity Capital | 100 | 100 | 100 |
Reserves | 6,000 | 7,000 | 8,000 |
Borrowings (total) | 2,000 | 2,200 | 2,500 |
Total Liabilities | 4,500 | 5,000 | 5,500 |
Total Assets | 12,000 | 13,500 | 15,000 |
Fixed Assets (approx.) | 3,000 | 3,400 | 3,800 |
Book Value per Share (Rs.) | 60–65 | 70–75 | 80–85 |
Source: Screener.in, Titan annual reports
4.3 Cash Flow Statement Analysis
Titan’s operating cash flow has been strong and positive. The company uses this cash primarily to fund store expansion. Financing cash flow is negative because Titan pays dividends.
Table 3: Cash Flow Summary – FY23 to FY25 (approx., in Rs. Crore)
Cash Flow (Rs. Crore) | FY23 (approx.) | FY24 (approx.) | FY25 (approx.) |
|---|---|---|---|
Cash from Operating | 5,000 | 5,800 | 6,000 |
Cash used in Investing | -2,500 | -2,800 | -3,000 |
Cash from Financing | -1,500 | -2,000 | -2,200 |
Net Change in Cash | 1,000 | 1,000 | 800 |
Source: Titan annual reports, Screener.in
4.4 Key Financial Ratios
Returns remain firm despite measured debt levels. Cash flow stays sufficient for ongoing operations.
Table 4: Key Financial Ratios – FY23 to FY25 (approx.)
Ratio | FY23 (approx.) | FY24 (approx.) | FY25 (approx.) |
|---|---|---|---|
Profitability | |||
ROCE % | 15% | 14% | 14% |
ROE % (TTM) | 21% | 22% | 21% |
OPM % | 13% | 11% | 10% |
Liquidity | |||
Current Ratio (approx.) | 1.4x | 1.4x | 1.3x |
Leverage | |||
Debt–to–Equity (approx.) | 0.3x | 0.3x | 0.3x |
Efficiency | |||
Debtors / Receivable days (approx.) | 40 | 45 | 50 |
Inventory turnover days (approx.) | 120 | 125 | 130 |
Source: Screener.in, Titan annual reports
4.5 Year-on-year comparison
Earnings rose yearly by roughly 15 to 18 percent.
Profitability remains stable with ROCE near 14–15 percent and ROE in the low twenties.
Growth happens without strain since financing relies more on internal funds than borrowing.
5. Key Insights and Interpretation
5.1 Strengths
Titan controls several well-known labels—Tanishq, Titan, Titan EyePlus, and Fastrack—that consumers rely on repeatedly.
With shops spread across major urban centers and smaller towns, its retail footprint ensures broad market access.
Returns on capital hover near 14–15%, while equity gains sit just above 20%.
Bolstered by the Tata group, credibility grows through easier access to funding.
5.2 Weaknesses
Facing big swings in gold costs often shapes profit levels unpredictably.
Funds tied up in stock and client balances mean steady injections of capital are needed.
5.3 Risk factors
When economies slow, family spending shrinks—luxury goods such as jewelry see fewer buyers.
Firms operating inside regulations could see margins shrink when facing off against unregulated rivals.
Regulatory changes related to gold or GST may impact operations.
5.4 Future outlook
Titan shows consistent progress in jewellery along with growth in timepieces and vision care.
Growth may come from retail expansion and online platforms.
Titan seems financially sound, though gold prices remain a key factor.
6. Conclusion
Now sitting at 57,818 crore, revenue shows clear upward movement since FY23’s 38,367 crore. Profit after tax follows a similar path, rising steadily alongside sales. Titan remains on solid financial ground. Returns on capital employed stand out within its industry group. Shareholders see nearly low-twenty percent gains on equity.
Sources:
1.Screener
2. BSE