The data most traders check, but few actually understand!
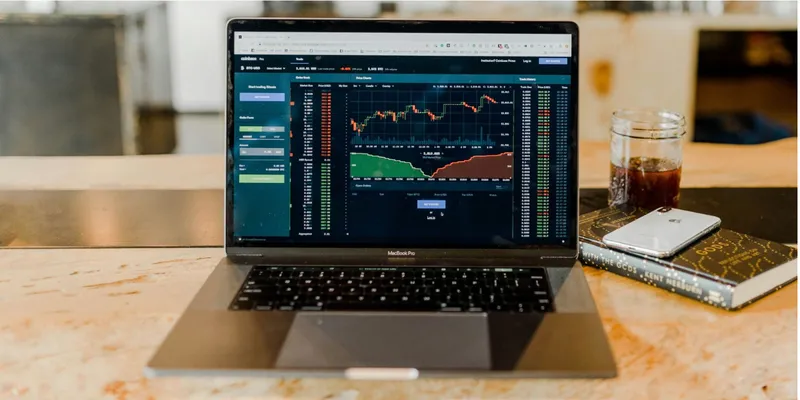
Modern trading platforms provide access to an enormous amount of market data. Traders can monitor price charts, trading volumes, open interest, volatility, delivery statistics and countless technical indicators in real time. While having access to more information is valuable, simply looking at data does not guarantee better trading decisions.
So many beginners check popular metrics regularly, but they actually do not understand them. Therefore, they may come to conclusions that do not accurately reflect the market. Learning how to interpret commonly used data can help traders make more informed decisions instead of reacting to isolated numbers.
Price tells you what happened, not why
Price is usually the first thing traders notice. It reflects the latest agreement between buyers and sellers, but it doesn't explain what caused the move.
For example, a stock may rise because of strong earnings, positive sector sentiment or short covering. Although the price movement looks similar on a chart, the reasons behind it can be completely different.
This is why experienced traders often combine price action with other market data before forming a trading view.
Volume reveals the strength behind a move
Trading volume represents the number of shares or contracts exchanged during a specific period. It helps traders understand how much market participation supports a price movement.
Picture a stock moving beyond a significant resistance level. If the breakout is on big volume, it shows higher market participation than if the same breakout was on very low volume.
Open interest is often misunderstood
Open interest tracks the total number of active, unsettled derivative contracts currently open in the market. Meaning it reflects positions that have not yet been closed or settled.
An increase in open interest generally suggests that new positions are being created, while a decline may indicate that existing positions are being closed.
Still, rising open interest does not automatically mean prices will continue moving in the same direction. It should always be analysed alongside price movement and overall market conditions. Many derivatives traders combine open interest with option chain analysis to identify active strike prices, monitor changes in market positioning and gain additional context before making trading decisions.
Volatility measures expectations, not certainty
Volatility measures the expected magnitude of future price movements, not the direction or certainty of those moves.
For options traders, implied volatility plays an important role as it influences option premiums. Higher implied volatility generally increases option prices, while lower implied volatility tends to reduce them.
Look at the context behind the move
Successful traders rarely rely on a single indicator. Instead, they combine multiple sources of information to build a more complete picture of market behaviour. Interpreting the market with only one signal can lead to wrong conclusions.
Suppose a trader notices rising open interest. Without checking price action, volume or market news, they might assume a strong trend is developing. But if price is moving sideways without sufficient trading volume, the interpretation may be very different.
Avoid information overload
Beginners usually try to analyse every available indicator at the same time. More data does not necessarily improve decision-making.
A practical approach is to focus on a small group of complementary tools. For example, combining price action, volume, open interest and volatility can often provide sufficient insight without making the analysis unnecessarily complicated.
Conclusion
Market data is most valuable when it is properly understood rather than simply observed. Price, volume, open interest and volatility each provide useful insights, but none of them should be interpreted in isolation.
Instead of searching for a single number that predicts the next market move, traders should focus on understanding how different data points interact.