TEXTILE MACHINERY, PARTS & ACCESSORIES RISE OF THE PHOENIX
Just as the global Covid-19 pandemic struck a complete structural disruption around the world throughout 2020-21. The current fiscal year too started on a gloomy note when the second wave of the deadly disease broke out across the globe causing fresh havoc. It appeared that the renewed lockdown measures to contain mass population, industry and the institution from contracting the pandemic didn’t yield much result as there were mixed reactions from different quarters of the polity, community and decision makers globally on the issues of sustaining lives versus economies. While the developed countries including India were successful in developing the Covid-19 vaccine and initiating the mass vaccination programs, the rate of inoculating the populace proved insufficient.
However, just like the bouncing back of the Indian Textile Engineering Industry (TEI) in Q3, Q4 of the 2020-21, the Indian TEI rose to the occasion again right after the wash out of business in Q1 2021-22. As reported earlier by TMMA(I), the Indian TEI managed to reduce its annual production losses in the year 2020-21 by -5% only to Rs. 5093 crores from Rs. 5355 crores in 2019-20. Whereas, the reported figures as on date have already surpassed an estimated production figure of about Rs. 8000crores. The chart below substantiates the claim here.
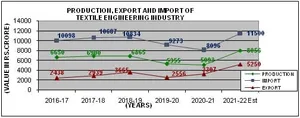
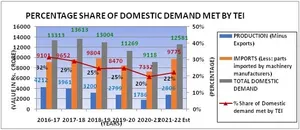
The estimated production, export and import figures above signals a sharp rise in production by +52% (INR 8056 crores), in exports by +70% (INR 5250 crores) by scaling up its peak figures in 2017-18 of INR 6900 crores and in 2018-19 of INR 3665 crores respectively. Whereas the imports may also scale up its peak to INR 11500 crores in the current fiscal as against INR 10834 crores in 2018-19. Most interestingly, the exports by the Indian TEI have risen from 37% of the domestic production in 2016-17 to 65% in 2021-22 (Est.), whereas the imports by the Indian TEI have marginally come down from 152% of the domestic production during the same time period to 143%. The domestic demand met by the indigenous production could be seen rising to 22% in 2021-22 (est.) from 20% in 2020-21.
Production figures of Textile Spares and Accessories:
While delving more into details on the value-wise overall production data of different categories of the industry during the last 6 years including the estimated figures for 2021-22 as on date; the spares and the accessories segment also has topped its consumption level. While the 2020-21 reflected the lowest production of INR 777 crores, the current year may witness it rising to INR 1229 crores, a rise of +58%.
CATEGORY | 2016-17 | 2017-18 | 2018-19 | 2019-20 | 2020-21 | 2021-22 Est. |
SPINNING & ALLIED MACHINES (8444 & 8445) | 3615.00 | 3815 | 3625 | 2545 | 2522 | 5000 |
SYNTHETIC FILAMENT YARN MACHINES (8445) | 400.00 | 385 | 400 | 350 | 278 | 200 |
WEAVING & ALLIED MACHINES (8446) | 900.00 | 885 | 890 | 715 | 454 | 600 |
PROCESSING MACHINES (8445, 8448 & 8451) | 635.00 | 650 | 750 | 655 | 884 | 900 |
MISC. (SPINNING, WEAVING & PROCESSING, JUTE) MACHINES (8448) | 30.00 | 35 | 25 | 30 | 29 | 2 |
TEXTILE TESTING & MEASURING INSTRUMENTS (9024) | 100.00 | 130 | 165 | 165 | 100 | 75 |
HOSIERY MACHINES/ HOSIERY NEEDLES (8447, 8448) | 65.00 | 80 | 85 | 80 | 52 | 50 |
TOTAL OF MACHINERY | 5745.00 | 5980.00 | 5940.00 | 4540.00 | 4318 | 6827 |
SPARES & ACCESSORIES (8448) | 905.00 | 920 | 925 | 815 | 777 | 1229 |
GRAND TOTAL | 6650.00 | 6900.00 | 6865.00 | 5355.00 | 5095 | 8056 |
% INCREASE/DECREASE | 1% | 4% | -1% | -22% | -5% | 58% |
Export figures of Textile Spares and Accessories:
It is estimated that the export of the spares and accessories will rise by 55% to INR 1600 crore in 2021-22 as compared to INR 1029 crores in 2020-21.
Import figures of Textile Spares and Accessories:
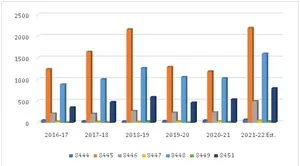
Similarly, it is estimated that the import of the spares and accessories will rise by 33% to INR 2500 crore in 2021-22 as compared to INR 1881 crores in 2020-21.
Description | 2016-17 | 2017-18 | 2018-19 | 2019-20 | 2020-21 | 2021-22 Est. |
8444 | 54.85 | 35.03 | 31.8 | 40.18 | 52.67 | 70 |
8445 | 1243.2 | 1645.4 | 2165.7 | 1293.2 | 1189.13 | 2200 |
8446 | 212.51 | 208.29 | 270.2 | 232.56 | 240.81 | 500 |
8447 | 29.73 | 19.68 | 17.06 | 31.8 | 31.85 | 50 |
8448 | 886.75 | 1008.2 | 1267.4 | 1060.6 | 1029.56 | 1600 |
8449 | 1.81 | 2.39 | 31.95 | 4.51 | 11.01 | 30 |
8451 | 352.97 | 477.77 | 593.64 | 463.89 | 542.2 | 800 |
Total Export | 2781.8 | 3396.8 | 4377.7 | 3126.7 | 3097.23 | 5250 |
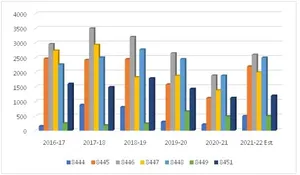
Description | 2016-17 | 2017-18 | 2018-19 | 2019-20 | 2020-21 | 2021-22 Est. |
8444 | 154 | 884 | 807.52 | 305.05 | 210.75 | 500 |
8445 | 2467 | 2421 | 2446.9 | 1580.4 | 1117.8 | 2200 |
8446 | 2964 | 3501 | 3210 | 2651 | 1887.74 | 2600 |
8447 | 2740 | 2938 | 1830.7 | 1879.3 | 1385.65 | 2000 |
8448 | 2265 | 2505 | 2776.1 | 2446.1 | 1881.95 | 2500 |
8449 | 249 | 182 | 242.6 | 654.78 | 488.54 | 500 |
8451 | 1605 | 1490 | 1792.4 | 1430.5 | 1123.87 | 1200 |
Total Import | 12444 | 13921 | 13106 | 10947 | 8096.3 | 11500 |
Conclusion:
The resilience shown by the industry could perhaps be due to ‘the pent-up demand’ during the lockdown periods of 2020-21 and 2021-22 or the ‘fear of missing out (FOMO)’ of the business opportunities thrown-in by the liquidity pumped in the market by the federal governments across the world or ‘the revenge buying of the end customer’ or else, the fact is the entire industry is alive and kicking back robustly. The discussions among the industry leaders (read spinning) have confirmed that they are full with orders till entire 2023 and they have stopped taking fresh orders. Though the other segments such as weaving & processing have still not picked up in proportion to the spinning segments, the percolation of the business opportunities down the value chain seems eventual. Therefore, if one is to coin a term for the state of the Indian TEI in the current times, ‘Rise of the Phoenix’ would be the most appropriate one.