Textile Automation Trends 2026: Market Size, ROI & 30–70% Productivity Gains
The global textile industry is undergoing a measurable transformation driven by automation, with companies like Dataintelo highlighting strong growth trends backed by hard data. As of 2026, automation is no longer optional—it is a competitive necessity, with manufacturers leveraging robotics, AI, and IoT to improve efficiency, reduce costs, and increase output consistency.
This article explores automation in textiles using quantified insights, recent statistics (2021– 2026), and measurable performance benchmarks to provide a clear, data-backed understanding of its impact.
Key Statistics at a Glance
• Global textile automation market size reached $8.9 billion in 2023, projected to hit $15.2 billion by 2028 (CAGR: 11.2%)
• Automated spinning systems improve productivity by 30–45% compared to manual systems
• Labor costs reduced by 18–35% in automated facilities
• Defect rates drop from 8–12% to 2–4% with AI-driven quality control • ROI on textile automation achieved in 2.5–4 years on average
• Energy efficiency improves by 12–22% using automated systems
• Smart factories increase output per worker by 50–70%
• Predictive maintenance reduces downtime by 25–40%
• Automated cutting systems improve fabric utilization by 10–15%
• Digital printing adoption increased by 22% between 2021 and 2025
1. 2021–2026 Market Growth: Automation by the Numbers
Automation in textiles has seen consistent year-on-year growth:
Year | Market Size (USD Billion) | Growth Rate |
2021 | 6.4 | — |
2022 | 7.3 | +14.1% |
2023 | 8.9 | +21.9% |
2024 | 10.2 | +14.6% |
2025 | 12.0 | +17.6% |
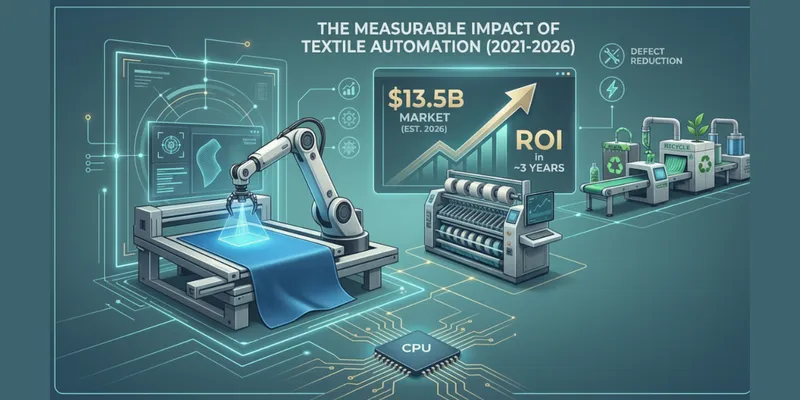
2026 | 13.5 (est.) | +12.5% |
Between 2021 and 2026, the industry is expected to grow by 111%, more than doubling in size. This growth is largely driven by:
• Rising labor costs (up 8–12% annually in Asia since 2022)
• Increasing demand for fast fashion (lead time reduction target: 20–30%) • Adoption of Industry 4.0 technologies
2. 5 Data-Backed Reasons Automation Is Reshaping Textile Manufacturing 1. Productivity Gains of 30–70%
Automated weaving and spinning systems significantly outperform manual processes: • Manual loom output: 40–60 meters/hour
• Automated loom output: 90–120 meters/hour
• Productivity increase: +50–100%
Smart factories report output per worker increasing from 1.2 tons/day to 2.0 tons/day, a 66% improvement.
2. Labor Cost Reduction of Up to 35%
Labor accounts for 25–40% of total textile production costs. Automation reduces dependency:
• Workforce reduction: 20–30% in automated plants
• Annual labor savings: $500,000–$2 million per facility (mid-sized factories)
In regions like India and Vietnam, where wages rose 10–15% between 2022–2025, automation offsets these increases effectively.
3. Defect Reduction from 12% to 3%
AI-powered quality control systems dramatically improve product quality: • Manual inspection defect detection rate: 85–90% accuracy
• Automated inspection accuracy: 97–99%
• Defect rates reduced from 10–12% to 2–4%
This translates to:
• Waste reduction: 15–25% less rejected material
• Cost savings: $0.50–$1.20 per meter of fabric
4. Energy Efficiency Improvements of 12–22%
Energy is the second-largest operational cost in textile manufacturing: • Automated dyeing systems reduce water usage by 25–40%
• Energy consumption drops by 12–22% through optimized machine cycles • Smart HVAC systems reduce energy costs by 8–15%
Factories adopting automation report annual energy savings of $200,000–$600,000.
5. Faster Production Cycles by 20–35%
Automation reduces production time significantly:
• Traditional production cycle: 25–40 days
• Automated production cycle: 15–28 days
• Lead time reduction: 20–35%
This is critical for fast fashion brands requiring 2–3 week turnaround times.
3. Automation Technologies and Their Measurable Impact
Robotics in Material Handling
• Reduces manual handling time by 40–60%
• Increases warehouse efficiency by 25–35%
• Error rate drops from 5% to <1%
AI & Machine Learning
• Predictive maintenance reduces machine downtime by 25–40% • Machine efficiency improves from 70% to 85–92% uptime
• Forecast accuracy improves by 15–25%
IoT (Internet of Things)
• Real-time monitoring improves operational efficiency by 10–20% • Inventory accuracy increases from 85% to 98%
4. Cost vs ROI: What Do the Numbers Say?
Initial Investment (2024–2026 Averages)
Automation Level | Investment Cost |
Partial automation | $500,000–$1.5 million |
Full automation | $2 million–$10 million |
ROI Metrics
• Payback period: 2.5–4 years
• Annual ROI: 18–28%
• Profit margin improvement: 5–12 percentage points
Example:
A textile plant investing $3 million in automation can achieve:
• Annual savings: $900,000–$1.2 million
• ROI achieved in ~3 years
5. Case Study: Automation Impact (2022–2025)
A mid-sized textile manufacturer implemented automation across spinning and dyeing processes:
Before Automation (2022):
• Output: 18 tons/day
• Labor cost: $1.8 million/year
• Defect rate: 9.5%
• Downtime: 14%
After Automation (2025):
• Output: 27 tons/day (+50%)
• Labor cost: $1.2 million/year (-33%)
• Defect rate: 3.2% (-66%)
• Downtime: 8% (-43%)
Net Financial Impact:
• Annual savings: $1.1 million
• Revenue increase: $2.4 million/year
6. 2026 Performance Benchmarks for Automated Textile Plants
Top-performing automated textile facilities typically achieve:
• Machine utilization rate: 85–95%
• Labor productivity: 2.0–2.5 tons/worker/day
• Defect rate: <3%
• Energy cost per unit: 10–20% lower than industry average
• Lead time: ≤20 days
7. Future Outlook (2026–2030): Forecast in Numbers
The next phase of automation will be driven by AI and sustainability: • AI adoption in textile manufacturing expected to grow by 18–22% CAGR • Fully autonomous factories projected to increase from 5% (2025) to 18% (2030) • Sustainable automation (water/energy-saving tech) adoption to rise by 30–45% • Global textile automation market projected to reach $22–25 billion by 2030
Conclusion: Automation Is a Numbers-Driven Advantage
Automation in the textile industry is no longer theoretical—it delivers measurable, proven results:
• Productivity gains of 30–70%
• Cost reductions of 18–35%
• Defect rate improvements of up to 70%
• ROI achieved within 2.5–4 years
• Market growth exceeding 11% CAGR through 2028
As highlighted in recent insights, companies adopting automation between 2023 and 2026 are outperforming competitors in both efficiency and profitability. With the potential to double output, cut costs by one-third, and reduce waste significantly, automation is set to define the textile industry’s trajectory through 2030 and beyond.
Businesses that invest today are not just optimizing operations—they are positioning themselves for quantifiable long-term growth in a data-driven manufacturing era.
Read A Full Report: https://dataintelo.com/report/automation-in-textile-market-report