Surbhi Industries Ltd

- INTRODUCTION
Started back in 1992, the company set up its base in Surat, India. Over-time it built a name making textiles. Yarn comes out of their units, along with knit fabrics. Woven materials are part of what they produce too. Garments round out the range they offer. Their main work centers on these four areas.
- Industry-Overview
Right now, the fabric-making business in India powers a big chunk of the nation's money flow - about 2.3 percent of the entire GDP rests on it. That same scene feeds 13 percent of all factory output across the land. On top of that, one out of every nine dollars earned abroad comes from selling these materials overseas. More than forty-five million people hold work because of this field.
- Purpose of the Analysis
The purpose of this report is to evaluate Surbhi Industries Ltd.'s financial health, operational resilience, and market positioning to determine its viability as an investment.
2. COMPANY-OVERVIEW
- Background-History
Started back in 1976 when Ratibhai Patel joined forces with Ravjibhai Patel, what began as a modest shuttle power loom unit slowly grew. Over time, it transformed - step by step - into a full-scale textile manufacturing setup. Most of the work happens at locations in Surat, where daily operations unfold quietly but steadily. To balance energy use, they rely on six wind turbines scattered through Gujarat and Maharashtra.
- Business-Model
Starting off, crepe and twisted yarns come out of their production line alongside multi-ply versions. Machines made by Picanol and Bonas handle intricate jacquard patterns with precision. Then there's warp knit tricot along with raschel fabrics rolling through. High fashion clothing uses these materials just as much as heavy-duty nets do. Equipment from Karl Mayer powers the knitting process for specific needs. Each product forms under tightly controlled conditions using smart automation.
- Key Products-Services
From spinning thread to crafting specialized fabrics, it manages each step internally. Powering most operations through owned wind and solar plants. Textile mills usually face steep electricity bills, but that burden shrinks here. Running on self-generated green energy keeps expenses lower than typical industry levels.
- Market-Position
Tiny compared to giants like Vardhman-Welspun, Surbhi holds a modest spot in the scattered world of Surat’s fabric makers. Its size - around ₹21 crores in value - keeps it rooted in local ground, away from national dominance. Custom work in small runs defines its rhythm, favoring flexibility over mass output. While that sharp focus helps with tailored orders, wider influence on prices stays out of reach.
- PROMOTER-FOUNDER INFORMATION
Name of-Promoter(s) /-Founder(s) | Professional Background | Role in Company Growth and Strategic-Decisions |
|---|---|---|
Ravjibhai Patel | 33 years of operational experience in the Indian textile manufacturing sector. | MD-CEO; the technological transition from basic looms to advanced electronic jacquards and drove the company's renewable energy integration strategy. |
Bipinbhai Patel | Background in financial planning, cost management, and corporate governance. | Chairman-CFO; responsible for establishing separate cost centers, managing capital allocation, and regulatory compliance. |
- FINANCIAL-STATEMENT ANALYSIS
- Income-Statement Analysis
Particulars-(₹ in Crores) | FY-2023 | FY-2024 | FY-2025 |
|---|---|---|---|
Revenue | 27.09 | 17.89 | 35.93 |
Net-Profit | 0.09 | -1.60 | 3.29 |
- Revenue-Chart
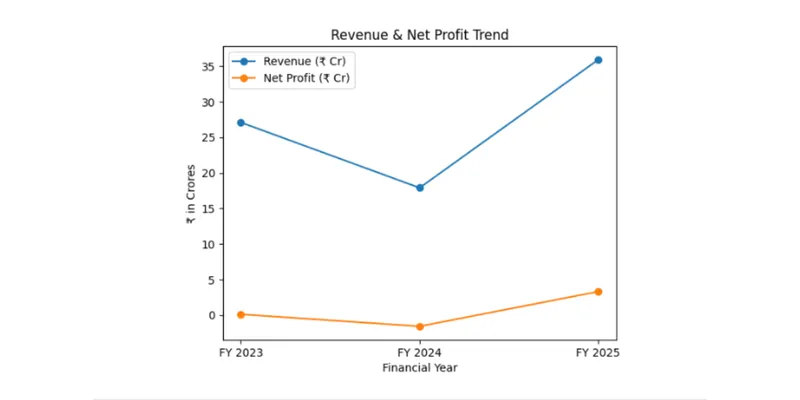
Key-observations:
- After a deep hit operations in 2024, things didn’t stay down long - by 2025, momentum roared back fast.
- Graph here shows five years of Surbhi’s earnings and costs, laid out clearly. What looked unstable before now fits into a larger pattern. Each point on the timeline reflects actual results, nothing added.
Balance-Sheet Analysis-(Rs.-In crore)
Particulars | FY-2021 | FY-2022 | FY-2023 | FY-2024 | FY-2025 |
|---|---|---|---|---|---|
Share Capital | 3.44 | 3.44 | 3.44 | 3.44 | 3.44 |
Total Reserves | 12.45 | 13.58 | 11.81 | 10.37 | 13.66 |
Borrowings | 0.66 | 11.60 | 11.62 | 8.99 | 6.88 |
Fixed Assets | 7.46 | 15.30 | 18.87 | 18.52 | 18.06 |
Current Assets | 12.87 | 17.50 | 15.79 | 12.46 | 13.08 |
Current Liabilities | 4.63 | 5.50 | 7.02 | 7.57 | 10.18 |
Total Assets | 20.47 | 33.53 | 35.23 | 31.55 | 34.81 |
Key-observations:
- A solid gain in profits during fiscal year 2025 lifted retained earnings, pushing total reserves back up to ₹13.66 crore. This recovery helped rebuild equity after earlier pressure on the balance sheet.
- Even with sales doubling in FY 2025, the company handled its rising liabilities without leaning too hard on risky borrowing. The debt load grew - yet stayed balanced, keeping long-term stability within reach.
- Cash-Flow Statement Analysis (Rs. In crore)
Particulars | FY-2021 | FY-2022 | FY-2023 | FY-2024 | FY-2025 |
|---|---|---|---|---|---|
Operating Cash Flow | 3.36 | 1.27 | 7.46 | 5.16 | 8.75 |
Key-observations:
- That year saw Surbhi Industries bring in steady cash despite losses. Remarkably, its operations still generated ₹5.16 Cr in cash during FY24.
- Five years of average cash flow beats the stated bottom line every time. That gap shows how much accounting charges - say, wear and tear on big machinery - drag down profit numbers, yet daily trading keeps bringing in solid cash.
- Key Financial Ratios for FY25
Particulars | FY 2021 | FY 2022 | FY 2023 | FY 2024 | FY 2025 |
|---|---|---|---|---|---|
Return on Equity (ROE) | 9.9% | 6.8% | 0.6% | -11.0% | 21.3% |
Return on Capital Employed | 10.1% | 11.3% | 4.9% | 0.3% | 14.8% |
Debt to Equity (x) | 0.33 | 0.62 | 0.99 | 1.08 | 0.96 |
Asset Turnover (x) | 0.89 | 1.07 | 0.84 | 0.59 | 1.18 |
Year-on-Year Comparison (3 years)
- Company makes good money for owners now, since its return on equity hit 21.31%, flipping last year's loss of 11.01%.
- Cash flow looks stable, because today’s current ratio stands at 1.28 times - assets are clearly bigger than debts.
- Borrowed funds sit at a reasonable level, shown by the 0.84 times debt-to-equity balance between loans and retained earnings. Every rupee tied up in assets brought in 1.18 rupees of sales, which beats the old 0.59 turnover hands down.
5. KEY INSIGHTS-INTERPRETATION
- Strengths
Backward integration into renewables - like wind power and half-covered solar rooftops - slashes costs. Cash flow tells a story too. Over five years, CFO versus PAT hits 5.85, which beats most tiny rivals by far.
- Weaknesses
That stock struggles with almost no trading activity, making it hard to sell. Its income swings wildly every few months, adding more risk. Lately, Surbhi’s numbers for Q3FY26 looked rough - sales dropped sharply, down 36.4% from last year to ₹6.72 Cr. Earnings took an even steeper fall, shrinking 71.7%, ending at only ₹10.76 lacs.
- Risk Factors
Prices for polyester and nylon swing hard, hitting the business fast. Then there's regulators watching close - not long ago, the BSE stepped in asking why shares jumped suddenly. Company leaders said it wasn’t inside news but just how markets sometimes move on their own.
- Future Outlook
The sharp drop in Q3FY26 shows outside forces are hitting hard, even after a strong recovery in FY2025. What happens next depends on locking down steady deals for those high-performance materials they make. Without consistent orders, bumpy results will likely stick around.
6. CONCLUSION
Strong cash from operations carried FY 2025, lifting returns well above average at 21.31%. Debt stayed under control - just 0.84 times equity. Yet cracks appeared fast when Q3 of FY26 shrank sharply. That sudden dip exposes how easily market swings can shake the whole setup.
Surbhi trades like a risky small player with pockets of hidden worth. When operations tighten up, gains can surge suddenly, just like they did around fiscal year 2025. Still, shaky profits lately make it hard to trust for steady growth investing. Movement in revenue trends each quarter needs clear signs of strength first.
Data-Sources