SPL Industries Ltd

1. Introduction
From Ludhiana, SPL Industries Ltd began operations in 1994, making knitwear and apparel for domestic use as well as overseas markets. You can find its stock listed on both the NSE under SPLIL and the BSE with code 532651. Though rooted locally, the company reaches global buyers through export channels. Trading happens daily across these two major exchanges without relying on third-party platforms.
A surge hit the business during FY22-FY23, pushing revenue past ₹280 crore as knitwear pulled in buyers after lockdowns ended. Since then, though, numbers have dropped sharply - almost cutting in half from their high point - as overseas appetite weakened. That shift dragged down results steadily through 2025.
Only time will tell if this dip is just a pause or the beginning of something longer. Whether it bounces back soon feels unclear right now.
2. Company Overview
SPL manufactures and exports knitted fabric (grey and finished) as well as readymade knitwear. Its facilities are in Ludhiana, which is India's hosiery manufacturing hub. A strong financial position marks this business, carrying almost no debt. Despite that, it serves a varied range of clients. From local wholesalers to large institutions, its reach extends overseas too. Across Europe and into the Middle East, demand remains steady.
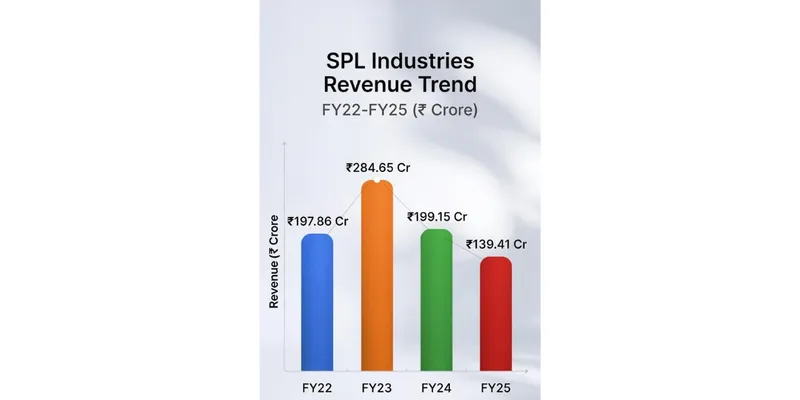
A record Rs.284 Cr marked the firm’s peak income during FY23. Two years later, by FY25, revenue stood at just Rs.139 Cr - down 51%. Though part of the drop came after pandemic-driven demand faded, competition may have chipped away share too. Highs rarely last; this one didn’t.
- Products: Knitted fabric, knitted garments, hosiery products
- Export Markets: Europe, Middle East
- Location: Ludhiana, Punjab — India's hosiery manufacturing hub
- Promoter Holding: 74.9% (strong majority)
- Debt Status: Almost debt-free (borrowings near zero in FY25)
3. Promoter & Management
SPL Industries is promoter-controlled with 74.9% holding — one of the highest in its peer group. The promoters are based in Ludhiana and have deep roots in the knitted textile trade. The strong promoter holding has meant no dilution even during the revenue slump, which is a positive signal for minority shareholders. However, the absence of dividends despite years of profitable operations (until FY25) raises questions about capital allocation policy.
4. Financial Statement Analysis
Income Statement
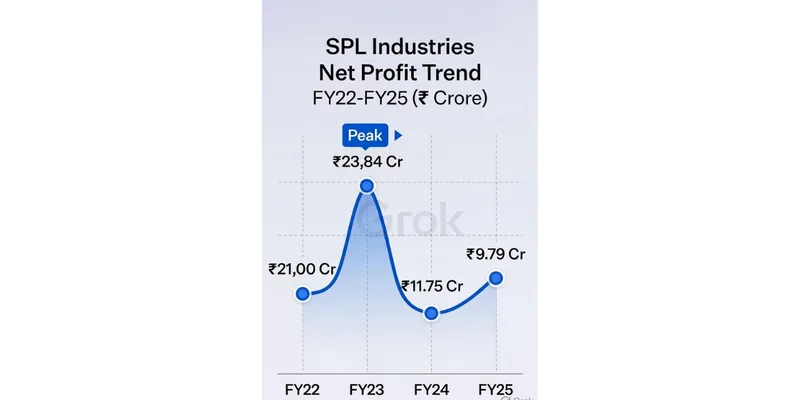
Good results came through in 2022 and 2023 - earnings hit 197 crore and then rose to 284 crore, while bottom lines stood strong at 21 crore and 23 crore. After that, a shift unfolded: income dipped down to 199 crore in 2024, earnings shrinking further to just 11 crore. Next year brought more decline - with revenues sliding again, now at 139 crore, profits edging lower still, ending near 9.79 crore. Profitability held on, yet room between costs and returns has narrowed sharply since before.
Metric (Rs. Cr) | FY22 | FY23 | FY24 | FY25 |
|---|---|---|---|---|
Revenue | 197.86 | 284.65 | 199.15 | 139.41 |
Operating Profit | 22.07 | 24.12 | 9.95 | 3.88 |
OPM % | 11% | 8% | 5% | 2.8% |
Net Profit (PAT) | 21.08 | 23.84 | 11.75 | 9.79 |
EPS (Rs.) | 7.27 | 8.22 | 4.05 | 3.38 |
Balance Sheet
This is where SPL stands out positively. Almost zero borrowings, growing reserves from retained profits, and a clean balance sheet. Equity has grown steadily from Rs.134 Cr to Rs.209 Cr over four years purely through earnings retention. Investments (likely in securities or subsidiaries) grew significantly to Rs.105 Cr by FY25.
Metric (Rs. Cr) | FY22 | FY23 | FY24 | FY25 |
|---|---|---|---|---|
Total Assets | 210.17 | 209.10 | 208.16 | 222.13 |
Equity Capital | 29 | 29 | 29 | 29 |
Reserves | 134.47 | 158.45 | 170.17 | 179.95 |
Borrowings | 4.93 | 10.66 | 0.00 | 0.00 |
Cash Flow Statement
Cash Flow (Rs. Cr) | FY22 | FY23 | FY24 | FY25 |
|---|---|---|---|---|
Operating CF | 8.08 | 14.00 | 7.15 | 20.70 |
Investing CF | −4.33 | −14.12 | −27.93 | −28.91 |
Financing CF | −0.43 | −0.41 | −1.81 | −14.02 |
Fresh inflows from operations jumped to Rs.20.70 Cr in FY25 even as sales dipped - pointing to tighter control over day-to-day funds. While revenue lagged, money moving out for investments stayed high, hinting at active placement into assets or new purchases.
Key Financial Ratios
Ratio | FY22 | FY23 | FY24 | FY25 |
|---|---|---|---|---|
ROE (%) | ~15% | ~15% | ~7% | 2.86% |
ROCE (%) | ~10% | ~8% | ~5% | 4.55% |
Net Margin (%) | 10.7% | 8.4% | 5.9% | 7.0% |
Debt-to-Equity | 0.03 | 0.06 | 0.00 | 0.00 |
EPS (Rs.) | 7.27 | 8.22 | 4.05 | 3.38 |
5. Key Insights & Interpretation
Strengths
- Virtually debt-free — one of the cleanest balance sheets in the sector
- Consistently profitable even in a revenue downturn
- Operating cash improved to Rs.20.7 Cr in FY25 despite revenue decline
- Strong promoter holding (74.9%) — aligned management
- Growing investments on the balance sheet suggest capital redeployment
Weaknesses
- Revenue fell 51% from FY23 peak — demand recovery is uncertain
- OPM compressed from 11% to under 3% — margin erosion is severe
- 3-year revenue CAGR: −11%; profit CAGR: −35% — clear downtrend
- No dividend paid ever — despite Rs.180 Cr in reserves
Risk Factors
- Post-COVID knitwear demand normalisation may persist longer than expected
- Export market competition from Bangladesh and Vietnam intensifying
- Large investing outflows (Rs.28.9 Cr in FY25) without clear disclosure is a risk
Future Outlook
SPL's near-zero debt and strong cash generation give it significant financial flexibility. But the revenue decline is the elephant in the room — the company needs to rebuild its order book. Q3 FY26 data shows TTM revenue at just Rs.77 Cr, suggesting FY26 may be even weaker on revenue. The saving grace is the investments on balance sheet — if these generate returns, reported earnings may not reflect the full operational picture.
6. Conclusion
SPL Industries is financially sound but operationally challenged. The clean balance sheet — zero debt, Rs.180 Cr in reserves — is a genuine strength that provides protection against the revenue slump. But investors need to see revenue recovery before getting excited. At the current stock price and P/E of 12x, the stock is moderately valued. The real question is whether the knitted garment demand cycle recovers in FY26–27 and whether SPL can recapture its FY23 revenue levels. A watchlist stock rather than an immediate buy.
Data Sources
- https://www.screener.in/company/SPLIL/
- BSE India: https://www.bseindia.com
- NSE India: https://www.nseindia.com