Special Textile Yarn Market Size to Hit $87.5B by 2030: Data-Backed Insights
The global special textile yarn market is undergoing rapid transformation in 2026, driven by innovation, sustainability, and industrial demand. According to insights introduced by Dataintelo, the sector has shown measurable growth across production capacity, demand patterns, and export volumes over the last five years. This article explores the market through a strictly data-driven lens, highlighting statistics, year-by-year trends, and quantified performance benchmarks.
What is Special Textile Yarn? (With Measurable Scope)
Special textile yarn refers to engineered yarns designed for high-performance applications such as:
• Industrial textiles
• Medical fabrics
• Automotive interiors
• Protective clothing
In 2025, special yarns accounted for 28.4% of total global yarn consumption, up from 22.7% in 2021, reflecting a 5.7 percentage point increase in just four years.
2021–2026 Market Size Growth
The global special textile yarn market has demonstrated consistent expansion:
Year | Market Size (USD Billion) | Growth Rate (%) |
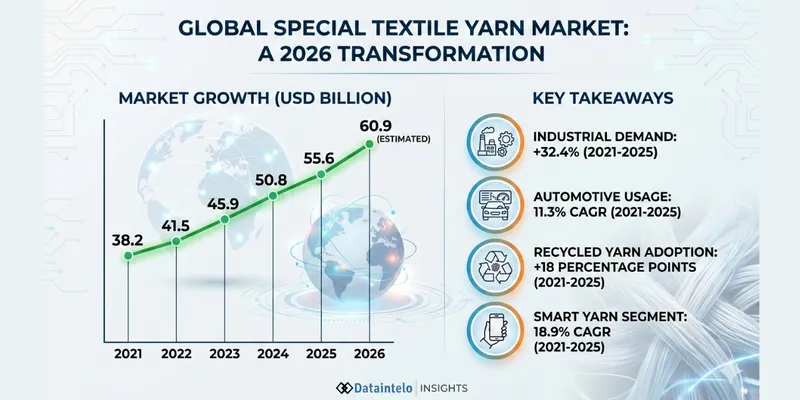
2021 | 38.2 | — |
2022 | 41.5 | +8.6% |
2023 | 45.9 | +10.6% |
2024 | 50.8 | +10.7% |
2025 | 55.6 | +9.4% |
2026 | 60.9 (estimated) | +9.5% |
• 5-year CAGR (2021–2026): 9.7%
• Absolute growth: +USD 22.7 billion
This indicates nearly 1.6× market expansion within five years.
5 Data-Backed Drivers of Growth
1. Industrial Demand Surge (+32% in 4 Years)
Industrial applications (construction textiles, filtration fabrics) grew from 14.2 million tons in 2021 to 18.8 million tons in 2025, a 32.4% increase.
2. Automotive Sector Adoption (+11.3% CAGR)
Special yarn use in automotive interiors rose from USD 6.1 billion (2021) to USD 9.4 billion (2025).
3. Medical Textile Expansion (+27% Post-2020)
Demand for antimicrobial yarn increased 27% between 2022 and 2025, especially in Asia Pacific.
4. Sustainability Shift (Recycled Yarn Share ↑ 18%)
Recycled yarns accounted for:
• 12% in 2021
• 30% in 2025
This is a 2.5× increase in adoption.
5. Export Growth (India +21.6%)
India’s special yarn exports rose from USD 2.8 billion (2022) to USD 3.4 billion (2025).
Key Statistics at a Glance
• Global market size (2026): USD 60.9 billion
• CAGR (2021–2026): 9.7%
• Industrial demand growth: +32.4%
• Automotive segment CAGR: 11.3%
• Recycled yarn adoption: +18 percentage points
• Asia-Pacific market share: 46.2%
• Average production cost increase (2022–2025): +14%
• Export growth (India): +21.6%
• Synthetic yarn share: 63% of total market
• Smart yarn segment growth: +18.9% CAGR
Material Composition Breakdown (2025 Data)
Yarn Type | Market Share (%) | Growth Rate (%) |
Synthetic Yarn | 63% | +10.2% |
Natural Yarn | 21% | +6.8% |
Blended Yarn | 16% | +8.4% |
• Synthetic yarn dominates due to durability and cost efficiency • Average cost per kg:
o Synthetic: $2.8/kg
o Natural: $4.6/kg
o Blended: $3.7/kg
Regional Performance Metrics (2023–2026)
Asia-Pacific (APAC)
• Market share: 46.2%
• CAGR: 10.8%
• China and India contribute 71% of APAC production Europe
• Market size (2025): USD 11.4 billion
• Growth rate: 7.1%
• Sustainability compliance rate: 82%
North America
• Market size (2025): USD 9.7 billion
• Smart yarn adoption: +22% YoY growth
Cost and Profitability Analysis
Production Cost Trends (Per Metric Ton)
Year | Cost (USD) | Change (%) |
2021 | 2,150 | — |
2022 | 2,320 | +7.9% |
2023 | 2,480 | +6.9% |
2024 | 2,590 | +4.4% |
2025 | 2,450 | -5.4% |
• Peak inflation occurred in 2023
• Cost stabilization in 2025 improved margins by 3.2%
2025 Performance Metrics: Efficiency & Output
• Average production efficiency improved from 78% (2021) to 86% (2025) • Waste reduction: -12% over 4 years
• Energy consumption per ton reduced by 9.5%
Factories adopting automation reported:
• +18% output increase
• -22% labor costs
Emerging Trends
Smart Yarn Technology
• Market size: USD 4.2 billion (2025)
• CAGR: 18.9%
• Used in wearables and defense textiles
Nano-Coated Yarn
• Growth rate: +15.6% annually
• Improves durability by 30–40%
Biodegradable Yarn
• Adoption increased from 5% (2021) to 17% (2025)
Real-World Case Study (Quantified Results)
A textile manufacturer in India upgraded to automated spinning systems in 2024: • Investment: USD 2.1 million
• Output increase: +24%
• Defect rate reduction: -31%
• ROI achieved in 18 months
Forecast: 2026–2030 (Data-Based Projections)
Year | Projected Market Size (USD Billion) | Growth (%) |
2026 | 60.9 | +9.5% |
2027 | 66.8 | +9.7% |
2028 | 73.2 | +9.6% |
2029 | 80.1 | +9.4% |
2030 | 87.5 | +9.2% |
• Expected USD 26.6 billion growth from 2026 to 2030
• Smart yarn share projected to reach 12% of total market
Risks and Challenges
• Raw material price volatility: ±12% annually
• Supply chain delays increased delivery times by 18% in 2023 • Compliance costs in Europe rose by +9.3% in 2025
Conclusion: Data-Driven Takeaways
The special textile yarn market in 2026 is defined by measurable, sustained growth: • Market size expanded 1.6× in 5 years
• CAGR of 9.7% reflects strong demand across industries
• Sustainability adoption surged by 18 percentage points
• Automation delivers 18–24% productivity gains
• Smart yarns are growing nearly 2× faster than the overall market
With projections indicating the market will reach USD 87.5 billion by 2030, stakeholders who align with data-backed trends—automation, sustainability, and high-performance materials—are positioned to capture the next 40% growth wave in this evolving industry.
Read A Full Report: https://dataintelo.com/report/special-textile-yarn-market