SM Energy Teknik & Electronics Limited
1. Introduction
SM Energy Teknik & Electronics Limited (SMENER) lists on BSE as a micro-cap, started February, 1982 in Thane, Maharashtra. It used to make and sell textile processing machines for bleaching, scouring, mercerizing, dyeing, printing, finishing gear for cotton, synthetics, blends, woven or knitted fabrics.
Business ran real till FY11–12 with Rs. 5.94–7.19 crore sales. Then revenues crashed from market and money stress. FY13 down to Rs. 0.04 crore. FY14 on, zero sales for eight years straight. Losses piled up, old payables grew, no cash to pay, so the board filed insolvency in Feb 2020.
Report covers background, promoters, finances from last data FY19–FY21 via Screener.in and BSE.
2. Company Overview
Background and History
SM Energy Teknik & Electronics set up Feb 1982 in Maharashtra, listed BSE. Made textile processing machines for fabric units across India. Lineup bleaching/scouring ranges, mercerizing, dyeing, printing, finishing for all fabric types. Peak FY10: Rs. 7.19 crore revenue, solid orders.
Business Collapse
FY12 on, sales tanked. Switched year-end to June FY12 (15 months), revenue Rs. 2.82 crore. FY13 (9 months): Rs. 0.04 crore. FY14–FY21: zero revenue for eight years. Still burned cash on admin, taxes, compliance small losses yearly. Rs. 6.22–6.43 crore other liabilities, old supplier dues unpaid.
CIRP Filing — February 2020
Feb 2020, board filed NCLT Mumbai under IBC Section 10 for voluntary insolvency. Means they can't keep going. No annual reports since FY19 on BSE. Last quarters Q3 FY20. Latest BSE note: Dec 2021 book closure for AGM bare minimum activity.
3. Promoter Introduction
Promoters held steady 55.60% since FY16 at least, no pledging. Last shareholding data March 2019. Key promoters/directors from FY2019 BSE report:
Name | Designation | Note |
|---|---|---|
Sushil M. Shah | Director / Promoter | Key promoter; Shah family |
Meena S. Shah | Director / Promoter | Family member |
Mihir S. Shah | Director | Family member |
Independent Directors | Independent Directors | SEBI rules |
Table 1: Promoters and Directors (Source: BSE Annual Report FY2019)
55.60% gives majority control. But filing Section 10 insolvency, not putting in cash or fixing otherwise, shows they handed it over.
4. Financial Statement Analysis
Note: No FY22–FY24 data on Screener.in or BSE. Tables cover FY19–FY21, last available years.
4.1 Income Statement (FY19–FY21)
Zero revenue all three years. Expenses just Rs. 0.02–0.22 crore on admin and compliance, no making or selling anything. Small ops losses: Rs. -0.22 crore FY19, -0.15 FY20, -0.02 FY21. FY21 better because CIRP meant bare minimum activity. No interest, depreciation, tax, or dividends. EPS negative since FY11.
Particulars (Rs. Crore) | FY19 | FY20 | FY21 |
|---|---|---|---|
Revenue (Sales) | 0.00 | 0.00 | 0.00 |
Total Expenses | 0.22 | 0.15 | 0.02 |
Operating Loss | -0.22 | -0.15 | -0.02 |
OPM % | N/A | N/A | N/A |
Interest | 0.00 | 0.00 | 0.00 |
Net Profit/(Loss) | -0.22 | -0.15 | -0.02 |
EPS (Rs.) | -0.18 | -0.12 | -0.02 |
Table 2: Income Statement — FY19 to FY21 (Source: Screener.in)
FY22–FY24 data not available
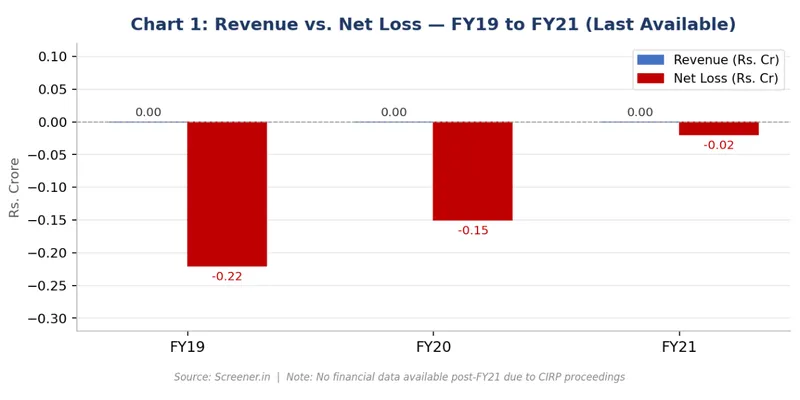
Chart 1: Revenue vs. Net Loss — FY19 to FY21 (Source: Screener.in)
4.2 Balance Sheet (FY19–FY21)
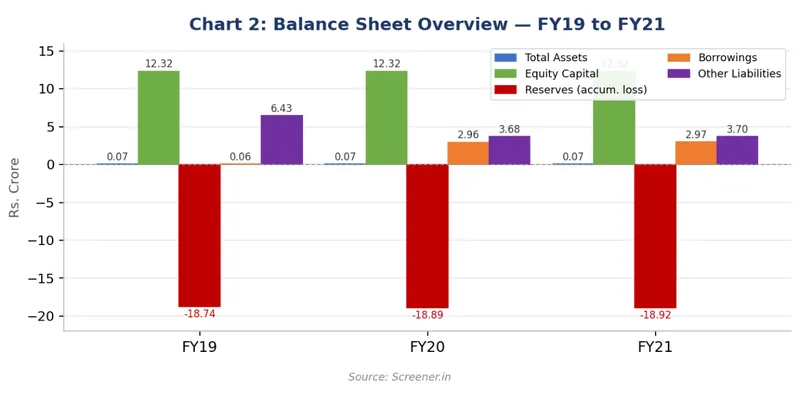
The balance sheet looks rough. Equity capital Rs. 12.32 crore, but reserves -18.74 to -18.92 crore from years of losses—equity wiped out. Net worth -6.42 to -6.60 crore, book value Rs. -5.36/share (Screener). Assets just Rs. 0.07 crore, basically empty. No fixed assets. Other liabilities Rs. 3.68–6.43 crore, old creditor dues. Borrowings up Rs. 0.06 to 2.96 crore FY20, probably CIRP working capital.
Particulars (Rs. Crore) | FY19 | FY20 | FY21 |
|---|---|---|---|
Equity Capital | 12.32 | 12.32 | 12.32 |
Reserves (accum. loss) | -18.74 | -18.89 | -18.92 |
Borrowings | 0.06 | 2.96 | 2.97 |
Other Liabilities | 6.43 | 3.68 | 3.70 |
Total Assets | 0.07 | 0.07 | 0.07 |
Fixed Assets | 0.00 | 0.00 | 0.00 |
Book Value/Share (Rs.) | ~ -5.22 | ~ -5.35 | ~ -5.36 |
Table 3: Balance Sheet Summary — FY19 to FY21 (Source: Screener.in)
4.3 Cash Flow
Cash flat since FY17. Ops cash -0.02 crore FY19, then zero FY20–21. No investing or financing moves. Cash stuck no generation, no spending.
Cash Flow (Rs. Crore) | FY19 | FY20 | FY21 |
|---|---|---|---|
Operating | -0.02 | 0.00 | 0.00 |
Investing | 0.00 | 0.00 | 0.00 |
Financing | 0.00 | 0.00 | 0.00 |
Net Change | -0.02 | 0.00 | 0.00 |
Table 4: Cash Flow Summary — FY19 to FY21 (Source: Screener.in)
4.4 Key Ratios
Ratio | FY19 | FY20 | FY21 | Observation |
|---|---|---|---|---|
ROCE % | N/A | N/A | N/A | No capital |
OPM % | N/A | N/A | N/A | Zero revenue |
Revenue (Rs. Cr.) | 0.00 | 0.00 | 0.00 | 8 years zero |
EPS (Rs.) | -0.18 | -0.12 | -0.02 | Keeps losing |
Book Value/Share | ~ -5.22 | ~ -5.35 | ~ -5.36 | Deep red |
Promoter Holding | 55.60% | 55.60% | N/A* | *CIRP control |
Total Assets (Rs. Cr.) | 0.07 | 0.07 | 0.07 | Nothing left |
Table 5: Key Financial Ratios — FY19 to FY21 (Source: Screener.in)
FY22–FY24 data not available
5. Key Insights and Interpretation
Zero Revenue for Eight Years
Zero sales FY14–FY21, eight years straight. No orders, no machines running, no trading. Hung on as a listed shell, racking small admin losses yearly.
Accumulated Losses Exceed Equity by 3x
Rs. 12.32 crore equity capital vs. -18.92 crore reserves losses 1.5x original share money. Net worth -6.60 crore. Book value -5.36/share. Broke on paper over a decade.
Other Liabilities — Old Creditor Dues
Rs. 3.68 -- 6.43 crore other liabilities, unpaid suppliers, services, maybe taxes from old days. Sat there years.
CIRP Status — Unknown
The big question is the CIRP outcome. IBC says wrap in 180 days (up to 330). Filed Feb 2020—six years gone. Should be resolved, liquidated, or dropped by now. Nothing on BSE since Dec 2021 AGM notice.
6. Conclusion
SM Energy Teknik & Electronics Limited shows the worst operational shutdown in this series. Zero revenue eight years straight before filing CIRP in February 2020. Assets at just Rs. 0.07 crore vs. Rs. 3.70 crore other liabilities and -18.92 crore accumulated losses. No plant, no sales, no staff listed, insolvency dragging over five years.
No FY22–24 data, that says it all. Stock trades Rs. 3.48 on BSE, market cap Rs. 4.29 crore, pure gamble with zero fundamentals. Without CIRP resolution, liquidation, or drop—publicly out. No real investment case.
Sources:
- Screener
- BSE