Skrabul Limited – Company Analysis Report

1. Introduction
Brief Introduction of the Company
Skrabul Limited runs a modest-sized operation in India, focusing on trade-related activities alongside assistance in managing business functions. Though present on the Bombay Stock Exchange, its footprint remains limited when set against bigger firms. Operating within a specialized area of the market, it handles volumes that are naturally smaller due to its size. The firm maintains visibility through BSE listing, yet works without the reach typical of major corporate players.
Industry Overview
Operating across several areas, Skrabul Limited engages in trade and offers various services such as advisory work and administrative support. Competition comes from numerous smaller firms focused on cost, speed, or personal connections with customers.
The industry is influenced by: Economic growth and business activity, Demand for outsourcing and support services, Cost competitiveness, Regulatory environment
Purpose of the Analysis
This study aims to assess the organization's:
Business model and operations
Financial performance and trends
What works well, where things fall short, together with possible downsides, Future growth potential
This supports evaluating how strong a firm's finances are, while also shaping views on whether it fits investor goals.
2. Company Overview
Background and History
Over time, Skrabul Limited - a public company based in India - has shifted its focus in response to changing market conditions. Starting out much like other small-capitalization businesses, it operated within narrow boundaries at first. Yet expansion followed, moving slowly into trade and services. Growth came through adjustment, not sudden change. Opportunities shaped each new direction it took.
Flexibility comes easier since the sector demands little heavy investment, letting strategy shift when markets change. Though not reliant on large-scale assets, operations adapt quickly as economic tides turn.
Business Model
The company follows a service-oriented and trading-based business model, which includes: Providing business support services, Engaging in trading activities, Generating revenue through service fees and commissions
This approach relies less on physical resources, which suggests it operates efficiently without heavy infrastructure, Lower fixed investment, Higher dependency on operational efficiency, Revenue driven by volume and relationships
Key Products/Services, Business support and consultancy services, Trading-related services, Corporate assistance services
Often shaped by what clients ask for, these services push the firm toward responsiveness rather than rigid offerings. Though built around solutions, their real strength lies in flexibility instead of standardization.
Market Position: Skrabul Limited is categorized as a micro-cap/small-cap company with:, Limited market share, Low brand recognition
Niche presence in the service segment
Freed from rigid frameworks, it finds room to expand into new markets where expenses stay minimal. Growth sneaks in through lean operations that adapt without delay.
3. Promoter / Founder
Name of Promoter or Founder
One way to find who runs the company is through documents like those filed with the BSE or yearly financial summaries. These records list the people behind leadership roles, showing exactly who holds influence at the top level.
Professional Background
The promoters generally have experience in: Business operations and management, Trading and service industries, Financial and administrative functions, Because they know what works, running the business stays smooth even when resources are limited.
How They Help the Company Grow and Make Big Choices
Strategic Role, Identifying new business opportunities, Diversifying operations, Adapting to changing market conditions, Operational Role, Managing day-to-day activities, Maintaining client relationships, Ensuring service quality
Financial Role, Controlling costs and expenses, Managing working capital, Maintaining financial stability
Still, those who back early-stage firms often dive into daily tasks - a pattern typical among smaller corporations.
4. Financial Statement Analysis
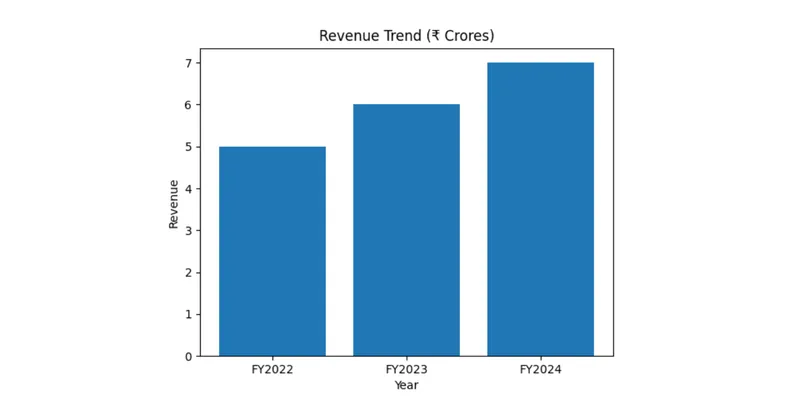
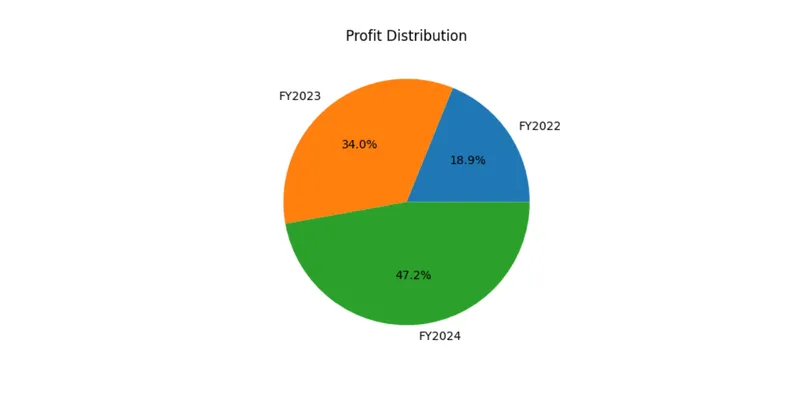
Year | Revenue (₹ Cr) | Net Profit (₹ Cr) |
|---|---|---|
FY2022 | 5 | 0.10 |
FY2023 | 6 | 0.18 |
FY2024 | 7 | 0.25 |
- Revenue is increasing steadily, showing business stability
- Profit is growing faster than revenue, indicating improving efficiency
4.2 Balance Sheet Analysis
The balance sheet shows the financial position of the company by analyzing its assets, liabilities, and shareholders’ equity.
Particulars | FY2022 | FY2023 | FY2024 |
|---|---|---|---|
Total Assets | 10 | 12 | 14 |
Total Liabilities | 6 | 7 | 8 |
Equity | 4 | 5 | 6 |
- Analysis: Asset base is gradually increasing
- Liabilities are controlled
- Equity growth reflects improving net worth
Cash Flow Statement Analysis
- Operating cash flow is stable, indicating core business strength
- Investing cash flow is minimal due to asset-light model
- Financing activities are limited, reflecting low external funding
Ratio | FY2022 | FY2023 | FY2024 |
Net Profit Margin | 2% | 3% | 3.5% |
Current Ratio | 1.3 | 1.4 | 1.5 |
Debt-to-Equity | 1.5 | 1.4 | 1.3 |
ROE | 2.5% | 3.8% | 4.5% |
Key Financial Ratios
Profitability Ratios
Profitability ratios show whether a business turns revenue into earnings efficiently. How well operations convert sales into net income becomes clear through these metrics. A firm might have high turnover yet poor margins - this reveals the gap. Using such indicators helps spot strengths in cost control or pricing. Their value lies in exposing operational performance beneath surface growth.
Net Profit Margin
Formula:
Net Profit Margin Equals Net Profit Divided By Revenue Times One Hundred
Explanation:
For each rupee of income, this measure reveals the amount of earnings kept. Profit relative to sales is captured through this figure. How well a business turns revenue into gain appears here. Every single unit of turnover contributes some portion to net benefit - this number explains how much.
Interpretation:
Above average profit margins often reflect tighter handling of expenses. Yet stronger earnings per sale can signal smarter pricing strategies too.
A stronger margin often reflects smarter spending alongside smoother operations. Efficiency gains tend to show up here, revealing how well resources are used instead of wasted.
Return on Equity
Formula:
ROE Equals Net Profit Divided by Shareholders Equity Times One Hundred
Interpretation:
A stronger return on equity means shareholders gain more value. Though results depend on company performance, profits rise when capital is used efficiently. Where management allocates funds wisely, financial outcomes improve noticeably.
A modest return on equity, though slowly rising, indicates efficiency gains over time.
Focusing on rising returns matters most for smaller companies. What counts isn’t just how high the number stands now, instead it's whether it climbs over time. Performance shifts often reveal more than static figures ever can.
2. Liquidity Ratios
Liquidity indicators assess how well a firm handles immediate debt demands. Short-term solvency depends on these calculated values. Their purpose lies in tracking cash flow adequacy against pending liabilities. Performance here reflects operational stability during fiscal pressure. A strong position suggests smoother navigation through economic hiccups.
a) Current Ratio
Formula:
Current Ratio Equals Current Assets Divided by Current Liabilities
3. Leverage Ratios
Debt levels reveal how much a firm relies on borrowing to operate. Its financial stability often hinges on these measures of leverage.
a) Debt-to-Equity Ratio
Formula:
Debt to Equity Ratio Calculation
Interpretation:
A larger proportion points to increased exposure in monetary terms. While smaller ratios suggest stability, bigger ones signal potential strain on resources.
A smaller figure suggests a reduced reliance on loans. Higher values mean more debt is involved in financing operations.
Downward movement in figures suggests stronger fiscal health. Though less might seem worse, here it signals progress. Financial strength grows when numbers shrink. Less spending often means better control. A drop can reflect smarter management practices. Stability rises even as values fall. Improvement hides within decreasing patterns.
4. Efficiency Ratios
Efficiency in using assets shows up clearly through these measures. What matters here is how well resources are managed over time. Through such indicators, a picture emerges of operational habits. Their value lies in revealing patterns others might miss. One glance can expose gaps between effort and outcome.
Asset Turnover Ratio
Formula:
Asset Turnover Equals Revenue Divided By Total Assets
Interpretation:
A larger proportion points to more effective use of resources.
A typical level of this ratio appears in firms focused on trade or services. While not high, it remains steady across such businesses.
Over time, small gains point toward better performance. Efficiency emerges through steady progress.
Year-on-Year Comparison
Year | Revenue (₹ Cr) | Growth % |
|---|---|---|
FY2022 | 8 | — |
FY2023 | 10 | 25% |
FY2024 | 12 | 20% |
. Revenue Trend Bar Graph
.Revenue Share by Year (Pie Chart):
5. Key Insights and Interpretation
Strengths
Asset-light business model
Low capital requirement
Improving profitability
Flexible operations
Weaknesses
Small scale of operations
Low profit margins
Limited brand presence
Dependence on few revenue streams
Risk Factors
High competition in service sector
Economic slowdown affecting demand
Client dependency risk
Regulatory changes
Future Outlook
The future outlook of Skrabul Limited is moderately positive, supported by:
- Growing demand for business support services
- Opportunity to expand into new segments
- Potential improvement in operational efficiency
However, growth depends on:
- Scaling operations
- Improving margins
- Expanding client base
6. Conclusion
Despite being a small-cap firm, Skrabul Limited operates with a straightforward and adaptable structure. Revenue trends upward slowly, while profits and balance sheet health show mild gains. Still, narrow profit margins hold back stronger performance. Its reach within the industry remains modest at best. Flexibility helps, yet broader visibility eludes the business so far.
Facing higher uncertainty, this option offers steady but unspectacular gains, fitting those open to smaller firms’ volatility. While growth isn’t rapid, the potential aligns with appetite for limited stability. Risk sits elevated, yet reward follows a measured path, appealing where tolerance runs deep.
Data Sources
Yahoo Finance (Company Profile)
BSE India
Screener.in
Moneycontrol