Seasons Textile Limited

- INTRODUCTION
Seasons Textiles Limited began in 1986 as part of the Seasons Group, growing into its most visible arm. Business clients turn to it first, yet home buyers also find what they need here. Though rooted in India, its reach stretches far beyond borders. Making high-end fabric is just one part; buying, selling, moving goods worldwide completes the picture. Early on, it helped shape how structured firms operate in this space.
- Industry Overview
One thing stands out about India's fabric and clothing sector - it lifts the economy by making up around 2.3% of the country’s overall output. This field powers 13% of industrial activity, showing how deeply it's woven into manufacturing life. On the world stage, exports from this area account for nearly one out of every eight dollars earned abroad.
- Purpose of the Analysis
This report evaluates STL’s fundamental financials, market standing, and operational efficiency to assess its overall business viability and financial health for stakeholders.
2. COMPANY OVERVIEW
Background and History
Starting in 1993, the business launched an IPO under Inderjeet Singh Wadhwa's leadership. Based out of Sonepat close to Delhi, it runs inside a tightly linked textile production zone.
- Business Model
STL works with both businesses and individual buyers. The company makes fabric goods, sending them overseas regularly. Instead of just selling old patterns, fresh ideas come out each year - about 600 drawn up by their own creative team. As tastes shift worldwide, these designs help keep things relevant. Online shoppers find the products through a website called S9Home, where items are offered straight to those who buy them.
- Key Products / Services
From cotton blended with synthetics comes fabric for curtains, furniture covers, and bed linens. Some resist stains, others push away dirt. Flame resistant versions exist alongside non-flame types. Technical weaves serve specific needs. Each piece built for function first.
- Market Position
Tiny compared to heavyweights such as Vardhman Textiles and Trident, STL holds a micro-cap status at around ₹12.4 crore in market value. Still, it sidesteps crowded fabric zones by skipping mass-market materials altogether. Instead, specialized flame-resistant and technical fabrics take center stage here.
- PROMOTER /FOUNDER INFORMATION
Name of Promoter(s) / Founder(s) | Professional Background | Role in Company Growth and Strategic Decisions |
|---|---|---|
Inderjeet Singh Wadhwa | Founder, Executive Chairman & MD. | Spearheaded the global export network, established the B2C segment (S9Home), and drives technical fabric innovation. |
Neelam Wadhwa | Deep industry experience in textile administration. Whole-Time Director. | Oversees daily operational management, capacity utilization, and workflow efficiency. |
4. FINANCIAL STATEMENT ANALYSIS
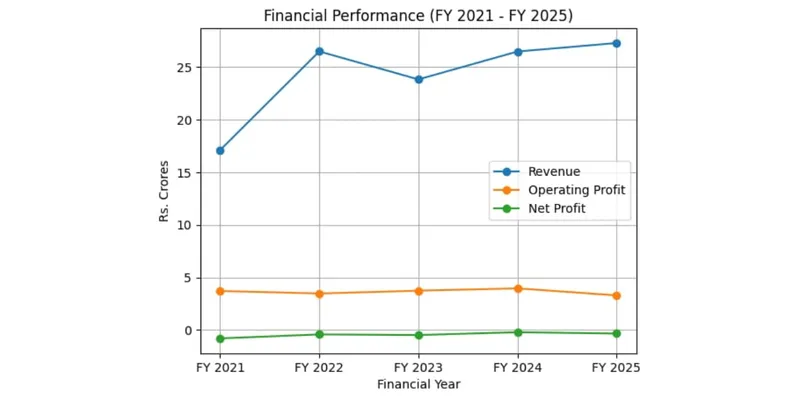
- Income Statement Analysis
Financial Year | Revenue (Rs. Cr) | Operating Profit (Rs. Cr) | Net Profit (Rs. Cr) | EPS (Rs) |
|---|---|---|---|---|
FY 2021 | 17.12 | 3.71 | -0.80 | -1.06 |
FY 2022 | 26.50 | 3.47 | -0.42 | -0.56 |
FY 2023 | 23.84 | 3.74 | -0.48 | -0.65 |
FY 2024 | 26.49 | 3.96 | -0.21 | -0.28 |
FY 2025 | 27.30 | 3.29 | -0.34 | -0.45 |
- Revenue Chart
- Balance Sheet Analysis (Rs. In crore)
Particulars (Rs. Cr) | FY 2021 | FY 2022 | FY 2023 | FY 2024 | FY 2025 |
|---|---|---|---|---|---|
Total Equity | 35.80 | 35.43 | 35.05 | 35.02 | 34.78 |
Borrowings | 18.74 | 17.13 | 15.65 | 12.82 | 10.84 |
Net Block | 37.57 | 36.37 | 37.23 | 36.53 | 35.79 |
Current Assets | 28.59 | 27.82 | 25.86 | 26.56 | 24.49 |
Current Liabilities | 10.09 | 10.27 | 11.08 | 14.29 | 13.78 |
Key observations:
- Borrowings have aggressively dropped from ₹18.74 Cr in FY21 to ₹10.84 Cr in FY25.
- Most of the value sits in machines fixed in place - net block at ₹35.79 Cr - common in fabric production units.
- Cash keeps flowing because what the business owns can handle its short-term bills without strain. A steady balance holds firm when near-term resources meet obligations head-on.
- Cash Flow Statement Analysis (Rs. In crore)
Cash Flow (Rs. Cr) | FY 2021 | FY 2022 | FY 2023 | FY 2024 | FY 2025 |
|---|---|---|---|---|---|
From Operations | -0.47 | 2.75 | 3.53 | 0.86 | 3.16 |
From Investing | -1.68 | -0.40 | -2.50 | -1.04 | -0.56 |
From Financing | 2.20 | -2.39 | -0.72 | 0.12 | -2.60 |
Key observations:
Spending on investments dipped slightly, showing ₹-0.56 Cr. The business isn’t pouring money into new assets. Instead of growing, it's focusing on keeping things running as they are. Equipment upgrades? Barely any. Expansion plans seem paused for now. Money stays put, used only where absolutely needed. Most of that money vanishes into shrinking long-term loans. Sharp interest costs pull more out fast.
- Key Financial Ratios for FY25(Indicative)
Ratio Category | FY 2021 | FY 2022 | FY 2023 | FY 2024 | FY 2025 | 5-Year Interpretation |
|---|---|---|---|---|---|---|
ROE (%) | -4.67 | -1.18 | -1.36 | -0.60 | -0.97 | Profitability: The business model is currently failing to yield any bottom-line returns on shareholder funds. |
Current Ratio | 2.83 | 2.70 | 2.33 | 1.85 | 1.77 | Liquidity: Current assets have dropped while current liabilities have slightly increased. |
Debt/Equity | 0.52 | 0.48 | 0.44 | 0.36 | 0.31 | Leverage: The steady decline highlights management's commitment to deleveraging, shifting the company toward a safer, equity-backed capital structure. |
ROCE (%) | 21.69 | 3.05 | 3.56 | 3.86 | 3.47 | Efficiency: After a volatile outlier in FY21, capital efficiency has flatlined well below the standard cost of capital, indicating weak pricing power in their target markets. |
Year-on-Year Comparison (3 years)
- Revenue grew by 3.05% YoY in FY25 27.30 Cr vs FY24 26.49 Cr.
- Net Loss -0.34 Cr in FY25 from -0.21 Cr in FY24, due to rigid interest expenses.
- Borrowings declined by 15.4% YoY in FY25 0.84 Cr from FY24 12.82 Cr
5. KEY INSIGHTS & INTERPRETATION
- Strengths
Most of the business belongs to one powerful owner who has not used it as collateral - that stake stands at 61.45%. This kind of backing often signals trust from those running things. Cash coming in from daily operations reached ₹3.16 crore, showing the machine keeps running on its own steam. Over five years, borrowed money dropped by more than 42%, proof that shrinking liabilities stays high on their list.
- Weaknesses
Loss after loss keeps piling up, dragging overall earnings into red territory - earnings per share landed at ₹–0.45 by fiscal year 2025. When it comes to handling interest payments through core business income alone, things look shaky; the coverage ratio sits at just 0.87.
- Risk Factors
Sky-high swings in cotton and synthetic yarn prices hit hard. Relying mostly on exports to Western nations means trouble when world economies wobble or borders tighten. On top of that, being a tiny player with thin trading volume pushes stock jumps around like wind-blown paper.
- Future Outlook
Moving up in Technical Textiles - especially flame-resistant materials - could keep STL alive. Success here matters more than ever. S9Home must catch on with buyers. Without real momentum, progress stalls. Growth in numbers is critical. Scale brings savings. That helps handle steady debt costs. Profits depend on it.
6. CONCLUSION
- STL barely breaks even despite paying down debt. Even though cash from operations keeps the lights on, profits stay flat year after year. Weak returns on capital keep showing up like a broken record. The balance sheet breathes easier now, yet long-term survival? That hinges on fixing what's under the hood.
- True, the stock looks inexpensive compared to net assets - price below one-third of book value. Yet that low number makes sense when profits keep shrinking and returns stay deep in the red. Seen another way, a few might see a chance if fabric exports suddenly rebound and loans get paid off soon. Hope rides on very narrow outcomes.
Data Sources