Saurer Group

Executive Summary
Saurer Group is a company based in Switzerland that produces textile machines, software, and automation solutions for the international textile industry. Saurer Group had poor financial performance in 2025 due to reduced sales and profits as well as poor operating performance. However, despite all the problems, Saurer Group remains competitive due to its strong global presence, advanced technologies, and emphasis on automation and digitalization of processes.
Company Overview
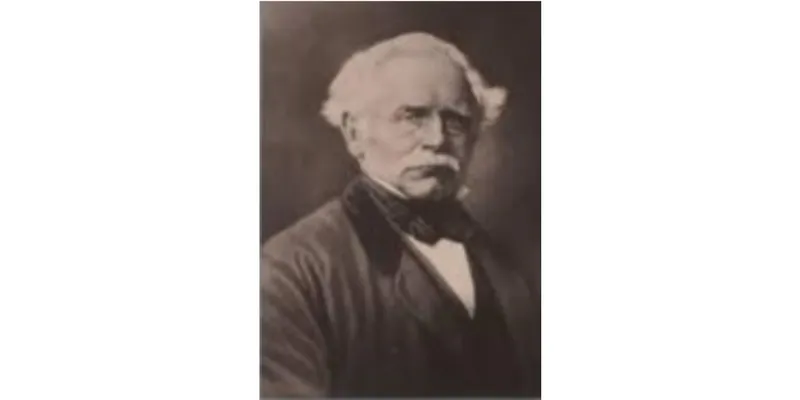
Saurer Group was founded by Franz Saurer in 1853. It manufactures heavy machines and software for spinning, twisting, and embroidery. It offers its customers a wide range of system solutions and services for spinning and twisting that support them on their path to sustainability, digitalization, and automation. Saurer is now publicly listed on the Shanghai Stock Exchange (WKN: 600545).
Industry Overview
This company operates within the industry of textile machinery that performs an important function in yarn processing, weaving, knitting, dyeing, and finishing. The increasing demand for automatic and sustainable manufacturing processes motivates this industry. Textile producers are becoming increasingly interested in using energy-saving machines to process recycled fibers. Asia-Pacific is the largest market owing to its robust presence of textile manufacturing industries.
Financial Performance Analysis
Particulars | 2024 (Million CNY) | 2025 (Million CNY) |
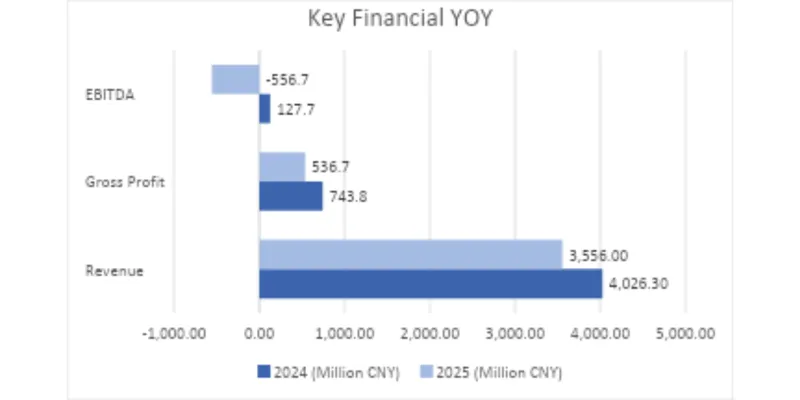
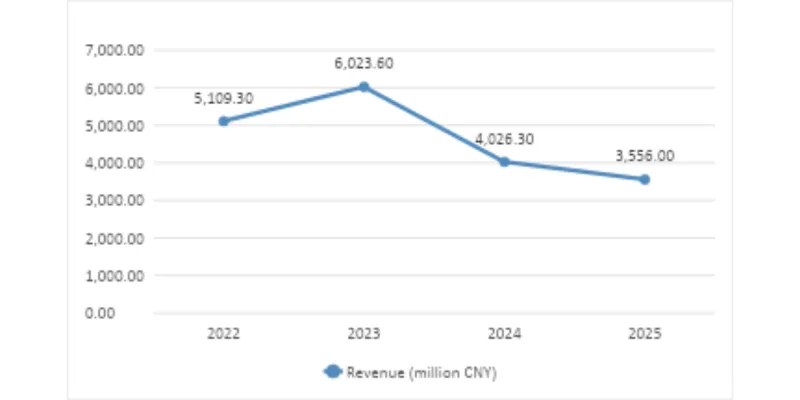
Revenue | 4,026.30 | 3,556.00 |
Gross Profit | 743.8 | 536.7 |
EBITDA | 127.7 | -556.7 |
Key Financial YOY
Revenue Trend Over 3–5 Years
Interpretation
Financial performance of the company declined in 2025. Revenue and gross profit experienced declining trends due to growing profitability pressures. Negative EBITDA has been reported by the company amid various challenges faced by the business, including high costs and inefficiency.
Key Financial Ratio
Ratio Category | Formula | FY 2025 | Interpretation |
Current Ratio | Current Assets / Current Liabilities | 1.23 | The company has enough current assets to pay its short-term liabilities. |
Quick Ratio | (Current Assets − Inventory) / Current Liabilities | 0.88 | The company may face some difficulty paying short-term liabilities without selling inventory. |
Gross Margin % | Gross Profit / Revenue × 100 | 15.09% | The company earned a low profit after covering production costs. |
Net Profit Margin % | Net Profit / Revenue × 100 | -17.26% | The company incurred a net loss in 2025. |
Return on Equity (ROE) | Net Profit / Shareholders’ Equity × 100 | -19.53% | The company generated a loss on shareholders' investment. |
Debt-to-Equity Ratio | Total Debt / Shareholders’ Equity | 0.83 | The company has a moderate level of debt compared to its equity. |
Interest Coverage Ratio | EBIT / Interest Expense | -9.30× | The company could not earn enough operating profit to pay its interest expenses. |
Inventory Turnover | Cost of Sales / Inventory | 2.60× | Inventory was sold at a slower rate during the year. |
Asset Turnover | Revenue / Total Assets | 0.39× | The company generated low revenue from its assets. |
SWOT Analysis
Strengths | Weaknesses |
Strong global presence with a well-established brand in textile machinery. | Revenue and profitability declined in 2025 due to weak market demand. |
Wide product portfolio including spinning, twisting, embroidery machines, software, and services. | Negative EBITDA and net loss indicate weak operational performance. |
Focus on automation, digitalization, and sustainable textile solutions. | Low asset utilization and slower inventory turnover reduce operational efficiency. |
Opportunities | Threats |
Growing demand for automated and sustainable textile manufacturing. | Intense competition from global textile machinery manufacturers. |
Expansion opportunities in emerging textile manufacturing markets. | Economic slowdowns may reduce customer investment in new machinery. |
Increasing adoption of Industry 4.0 and smart factory technologies. | Rising raw material, labor, and energy costs may pressure profitability. |
Conclusion and Recommendations
From the analysis, it can be seen that the Saurer Group experienced a tough financial year in terms of profitability and operational performance. Nevertheless, the strengths of the company in terms of being market leaders, having an innovative range of products, and sustainable technology give room for future growth.
References & Sources
- Saurer Group Official Website
- Yahoo Finance for financial Statements
- Microsoft Excel (Charts and Ratio Analysis)