Sasa Polyester

Executive Summary
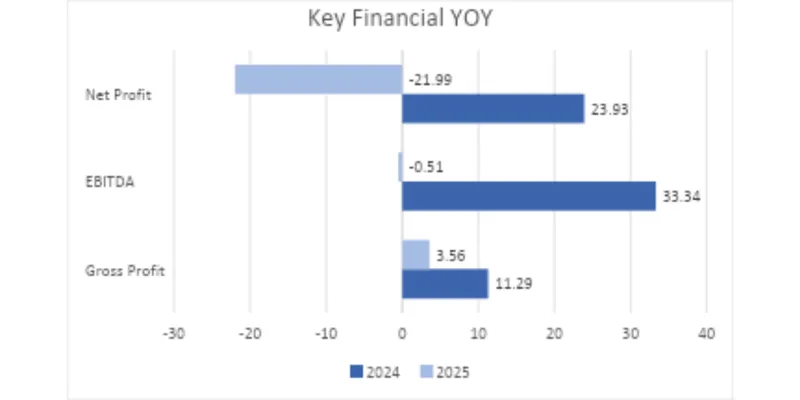
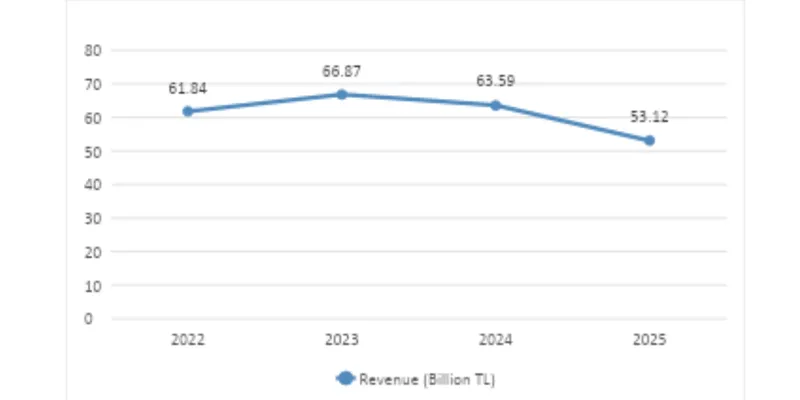
SASA Polyester is one of the top manufacturers of polyester and petrochemicals. The company is engaged in the production of various types of polyester fibers, yarns, and polymers that can be used for textile and packaging purposes. As per the financial analysis conducted, there has been a decrease in revenues, gross profit, EBITDA, and net income in 2025.
Company Overview
SASA is one of the world’s leading manufacturers of polyester fiber, filament yarn, POY, PET resin, and PET chips. It is a major Turkish chemical company owned by Özdemir Sabancı, founded in 1966, and based in Adana, Turkey. The company produces polyester fibers and yarns, polymers. SASA is a subsidiary of Erdemoglu.
Industry Overview
The group is engaged in the polyester and petrochemical sectors of industry. The group caters to sectors including textiles, packaging, automotive, pharmaceutical industry, among others. These industries have increasing demand for synthetic fibres, PET resins, and speciality polymers owing to high grade, price effectiveness, and versatility. On the flip side, international competition, prices, and demand for products of this industry are subject to fluctuation in terms of Crude oil prices as well.
Financial Performance Analysis
Particulars (TL Billion) | 2024 | 2025 |
Revenue | 63.59 | 53.12 |
Gross Profit | 11.29 | 3.56 |
EBITDA | 33.34 | -0.51 |
Net Profit | 23.93 | -21.99 |
4.1 Key Financial YOY
4.2 Revenue Trend Over 3-5 Years
4.3 Interpretation
Revenue decreased, which proves that sales in 2025 were lower. Gross profit also decreased, since the costs increased. EBITDA is significantly decreased, which means that the operating results are much worse than before. The firm also posted a net loss, which proves the worse financial performance of the firm.
Key Financial Ratio
Ratio | Formula | 2025 | Interpretation |
Current Ratio | Current Assets / Current Liabilities | 0.44 | The company has low short-term liquidity. |
Quick Ratio | (Current Assets − Inventory) / Current Liabilities | 0.22 | The company has low liquid assets to pay short-term debts. |
Gross Margin | (Gross Profit / Revenue) × 100 | 6.69% | The company earned a low gross profit from its sales. |
Net Profit Margin | (Net Profit / Revenue) × 100 | -41.39% | The company incurred a net loss during the year. |
Interest Coverage Ratio | EBIT / Finance Expense | 0.02× | The company struggled to cover its interest expenses. |
Asset Turnover | Revenue / Total Assets | 0.17× | The company generated low revenue from its assets. |
SWOT Analysis
Strengths | Weaknesses |
It is one of the biggest manufacturers of polyester in the EMEA region. | The company had earnings falling from TL 63.59 billion in 2024 to TL 53.12 billion in 2025. |
A wide range of products such as PTA, PET, polyester fiber, filament yarns, and polymers. | Poor liquidity, current ratio 0.44 and quick ratio of 0.22. |
Vertical integration reduces costs and improves supply chain management. | Net loss recorded by the company in 2025 of TL 21.99 billion. |
Opportunities | Strengths |
Increasing global demand for polyester fibers, PET resins, and specialty polymers. | Higher crude oil and raw material prices lead to higher manufacturing costs. |
Increasing attention toward sustainable and recycled polyesters. | High competition from international polyester and petrochemical companies. |
Entry into the value-added specialty chemicals segment and foreign markets. | Higher energy costs may affect profitability. |
Conclusion and Recommendations
From the above analysis, it is clear that the financial performance of the company declined in the year 2025 due to a decrease in sales, gross profit, EBITDA, and net profit. Even though SASA Polyester is experiencing various difficulties such as volatile prices of raw materials, increasing energy costs, and competition from other countries, it is still in a good position because of its long-term investments and diversified products.
References & Sources
- SASA Polyester Annual Report 2025
- SASA Polyester Official Website
- Yahoo Finance (Financial Statements)
- Microsoft Excel (Charts and Ratio Analysis)