SAHAJ FASHION
1. Introduction
Sahaj Fashions Limited makes and trades cotton fabric. Started in May 2011 in Kishangarh, Rajasthan. Produces shirtings, suitings, fancy fabrics, industrial cloth sells in Rajasthan, Gujarat, Maharashtra, Delhi.
India's textile scene is massive and tough, with Rajasthan full of fabric makers. Cotton fabric feeds garment, home furnishing, and industrial users. Margins tight, tied to cotton prices and orders.
Studies Sahaj Fashion’s business background, promoters, recent financials, and overall health
2. Company Overview
Background and History
Incorporated in May 2011, Kishangarh production began in April 2012.
Business Model and Products
Manufactures cotton fabric piece dyed/yarn dyed shirtings, cotton spandex suitings, slub fancy fabrics, linen, industrial cloth like duck/drill. Trades textiles too. All domestic sales.
Market Position
Micro-cap SME. Market cap ~Rs. 5.86 Cr Mar 2026, down from IPO Rs. 40 Cr. 3-year sales growth 19%. Small customer base in fragmented, competitive space.
3. Promoter Introduction
Sahaj Fashions is run by a Rajasthan family group. Key promoters and directors from NSE filings and the IPO prospectus include:
Name | Role | Background |
|---|---|---|
Norat Mal Choudhary | Promoter & MD | 20+ yrs industry experience |
Rohit Toshniwal | Promoter & Director | Key promoter family |
Sadhana Toshniwal | Non-Executive Director | 15 yrs experience |
Prabha Lakhotia | Promoter | Promoter group |
Table 1: Promoters and Directors (Source: NSE Filings)
Promoters control 64.65% of shares (Sep 2024 per Screener.in)—solid majority. No share pledging reported. Their stake hasn't budged since the September 2023 IPO.
4. Financial Statement Analysis
4.1 Income Statement (FY22 – FY24)
Revenue climbed nicely—from Rs. 87 Cr FY22 to Rs. 121 Cr FY23, then Rs. 125 Cr FY24. Solid sales growth.
Operating profit stayed in Rs. 6-8 Cr range with 5-7% OPM. Decent, steady margins. But interest eats Rs. 4 Cr yearly, wiping out most gains.
Net profit barely showed FY22, hit Rs. 2 Cr FY23, dropped to Rs. 1 Cr FY24. Thin profits after debt service. No dividends ever paid.
Particulars (Rs. Crore) | FY22 | FY23 | FY24 |
Revenue (Sales) | 87 | 121 | 125 |
Total Expenses | 81 | 113 | 119 |
Operating Profit | 6 | 8 | 6 |
OPM % | 6% | 7% | 5% |
Interest | 4 | 4 | 4 |
Depreciation | 1 | 1 | 1 |
Net Profit | 0 | 2 | 1 |
EPS (Rs.) | 0.57 | 2.70 | 0.71 |
Table 2: Income Statement Summary — FY22 to FY24 (Source: Screener.in)
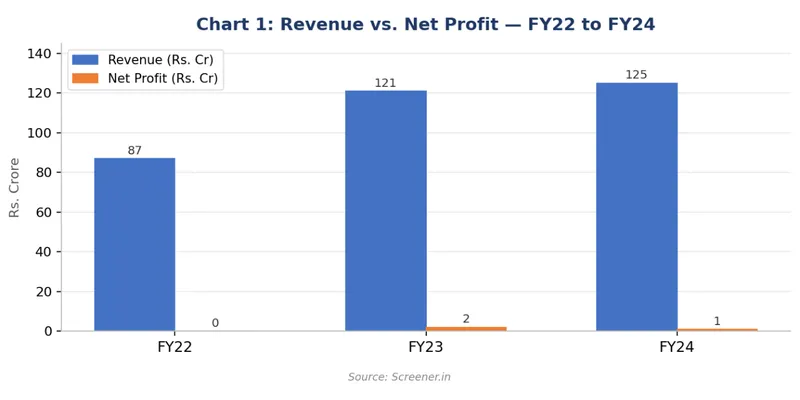
Chart 1: Revenue vs. Net Profit — FY22 to FY24 (Source: Screener.in)
4.2 Balance Sheet (FY22 – FY24)
Total assets went up from Rs. 73 crore to Rs. 85 crore by FY24. Shareholders equity jumped big—from Rs. 14 crore FY22 to Rs. 34 crore FY24. IPO in FY23 brought fresh capital.
Borrowings came down from Rs. 42 crore FY22 to Rs. 36 crore FY24—good direction. Still high though at nearly 1.06x equity (Rs. 36 Cr debt vs Rs. 34 Cr equity).
Fixed assets shrank yearly from Rs. 9 crore FY22 to Rs. 7 crore FY24—just depreciation at work.
Particulars (Rs. Crore) | FY22 | FY23 | FY24 |
Equity Capital | 7 | 9 | 13 |
Reserves | 7 | 11 | 21 |
Total Shareholders Equity | 14 | 20 | 34 |
Borrowings | 42 | 40 | 36 |
Other Liabilities | 16 | 13 | 15 |
Total Assets | 73 | 73 | 85 |
Fixed Assets | 9 | 8 | 7 |
Table 3: Balance Sheet Summary — FY22 to FY24 (Source: Screener.in)
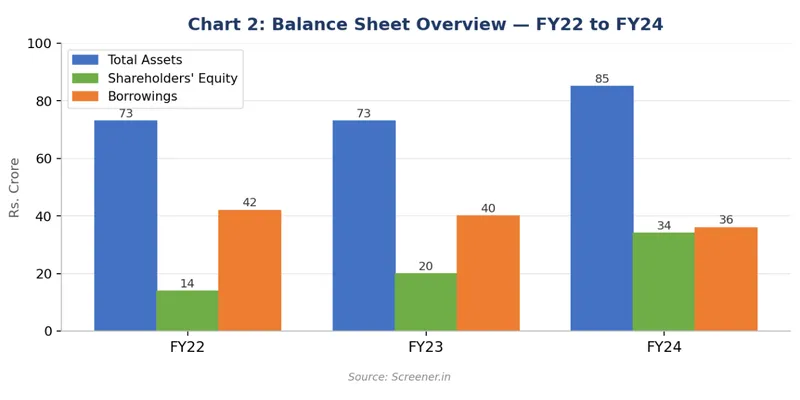
Chart 2: Balance Sheet Overview — FY22 to FY24 (Source: Screener.in)
4.3 Cash Flow
Operating cash flow stays consistently negative—Rs. -1 Cr in FY22, Rs. -1 Cr in FY23, Rs. -7 Cr in FY24. That big FY24 drop flags serious working capital buildup from receivables and inventory.
The company bridges the gap with financing cash inflows. Can't last forever. Net cash flow went negative in FY22 and FY24.
Cash Flow (Rs. Crore) | FY22 | FY23 | FY24 |
Operating | -1 | -1 | -7 |
Investing | 0 | 0 | -3 |
Financing | 2 | 1 | 9 |
Net Change | 1 | 0 | -1 |
Table 4: Cash Flow Summary — FY22 to FY24 (Source: Screener.in)
4.4 Key Ratios
Ratio | FY22 | FY23 | FY24 | Observation |
ROCE % | 8% | 12% | 8% | Moderate |
ROE % | ~0% | ~10% | ~3% | Inconsistent |
OPM % | 6% | 7% | 5% | Low but positive |
Debt-to-Equity | 3.0x | 2.0x | 1.06x | Improving |
Debtor Days | 193 | 119 | 132 | High |
Cash Conv. Cycle | 195 | 161 | 178 | Very high |
EPS (Rs.) | 0.57 | 2.70 | 0.71 | Volatile |
P/B Ratio | – | – | 0.17x | Deep discount |
Table 5: Key Financial Ratios — FY22 to FY24 (Source: Screener.in)
ROCE shows how well the company uses all its capital—8–12% counts as okay. ROE tracks shareholder returns, which bounced from 0% to 10% then 3%, so profits stay shaky. OPM at 5–7% means just Rs. 5–7 kept from every Rs. 100 in sales after ops costs—slim for manufacturing.
Debt-to-equity dropped from 3.0x to 1.06x, good news thanks to FY23 IPO cash. Debtor days hit 132, so customers pay after 4+ months—high and strains working capital. Cash conversion cycle at 178 days locks money in ops nearly 6 months before cash returns, explaining negative operating cash.
EPS jumped around from Rs. 0.57 to 2.70 back to 0.71—unreliable profits year to year. P/B at 0.17x trades 83% below book value. Could mean cheap stock, but the market doubts earnings strength right now.
5. Key Insights and Interpretation
Strengths
The company's revenue rose steadily from Rs. 87 crore in FY22 to Rs. 125 crore in FY24, proving it's good at making sales. Debt came down from Rs. 42 crore to Rs. 36 crore, and the debt-to-equity ratio improved a lot—from 3.0x to 1.06x. Promoters own 64.65% with no shares pledged. At 0.17x book value, the stock seems cheap next to its net assets.
Weaknesses
Revenues grew, but net profit is still super low, just Rs. 1–2 crore on Rs. 121–125 crore sales. High interest of Rs. 4 crore yearly wipes out most operating profit. Cash from operations was negative all years, getting worse to Rs. -7 crore in FY24. With 132 debtor days and a 178-day cash cycle, they're slow to collect money. No dividends ever paid.
Risk Factors
The worst issue is negative operating cash flows. The company can't generate cash from its core operations and depends on borrowing to stay afloat. Interest coverage is low, as noted on Screener.in. The customer base is too narrow, creating concentration risk. Legal proceedings against promoters and directors are listed in the IPO prospectus. NSE questioned delayed Q2 FY25 results, and data loss was the excuse for missing May 2025 financials—a big governance problem.
Future Outlook
Medium-term looks iffy. Sales are up, but profits are weak from debt and high interest. Lowering borrowings and better collections might help margins. IPO funds for working capital and debt reduction could make a difference. Uncertain FY25 results and compliance worries add doubt though.
6. Conclusion
Sahaj Fashions Limited makes textiles on a small scale. Revenues are growing, but profits stay weak. Data over three years shows sales jumping from Rs. 87 crore to Rs. 125 crore, with debt down and equity stronger after the IPO. That's good news. Still, negative cash flows every year, heavy interest costs, slim margins, and recent filing delays are real problems we can't overlook.
For investors, the stock trades at an 83% discount to book value, which might draw value hunters. But with bad cash generation, a long working capital cycle, and missing FY25 results, I wouldn't call it a strong buy right now.