RAJ RAYON INDUSTRIES LIMITED FINANCIAL AND BUSINESS ANALYSIS REPORT

1. Introduction
Beginning operations in Silvassa, Raj Rayon Industries Limited functions within India's artificial fibre and yarn sector. Despite past hurdles, progress became clear during the previous three fiscal periods following a demanding corporate overhaul. Textiles continue playing a central role in India’s industrial landscape - driven by home consumption, overseas markets, and increasing adoption of engineered fabrics.
2. Company Overview
Starting in 1993, Raj Rayon Industries Limited holds listings on both the BSE and NSE. Focused mainly on textiles, it works with polyester along with yarn production and texturising processes. After facing difficulties before, signs point to expansion efforts ramping up lately - this shift brought a steep rise in income beginning fiscal year 2023. Manufacturing drives its approach; profit levels rely heavily on how fully machines run, prices of inputs, and tight control over operating funds.
3. Promoter And Founder Introduction
Leading the company stands Mr. Rajkumar Satyanarayan Agarwal, holding position as both Chairman and Managing Director. In parallel, oversight includes Mr. Sandiip Satyanarayan Agarwal, serving full-time while managing financial direction. Strategy, daily function, even turnaround efforts - each shaped largely by decisions rooted within the Agarwal family.
4. Financial Statement Analysis
Income Statement Analysis:
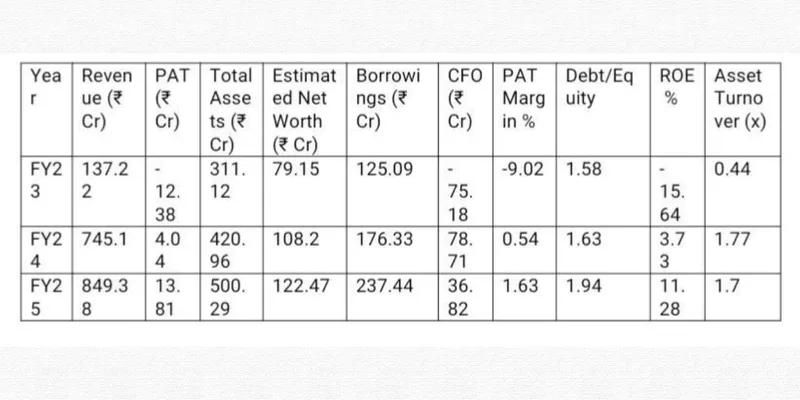
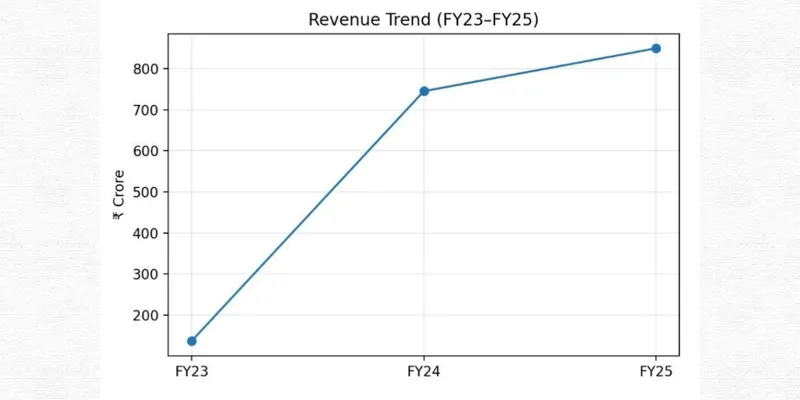
A jump took place in Raj Rayon's revenue - ₹137.22 crore became ₹745.10 crore within just one year by FY24, then rose again to ₹849.38 crore the following year. That growth signals a major shift upward in business size. Instead of losses, profits appeared: after losing ₹12.38 crore in FY23, net earnings turned positive at ₹4.04 crore in FY24, later reaching ₹13.81 crore in FY25. Margins followed suit - once negative at -9.02%, they moved into the green at 0.54% and climbed further to 1.63%. While improvement is clear, these returns still feel slim compared to the risks involved.
Balance Sheet Analysis:
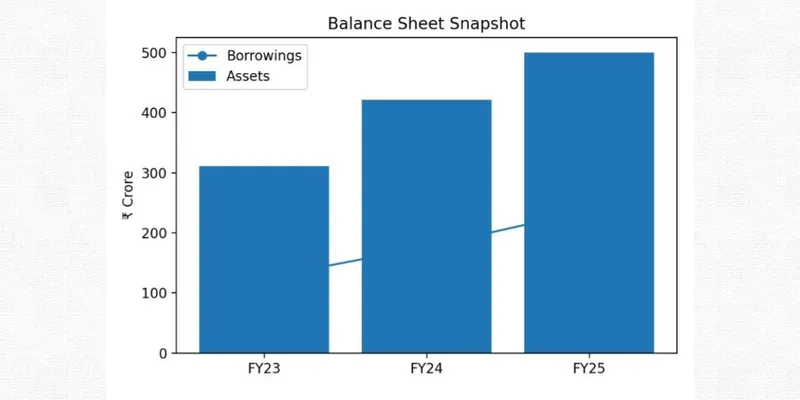
Starting at ₹311.12 crore, total assets climbed to ₹420.96 crore by FY24 - then reached ₹500.29 crore in FY25. From one year to the next, estimated net worth moved up too, rising from roughly ₹79.15 crore to ₹122.47 crore. Though smaller in scale, borrowings followed a similar path: beginning at ₹125.09 crore and ending near ₹237.44 crore two years later. That increase suggests part of the expansion came through borrowed funds. Because of this pattern, size has clearly grown - but so has reliance on debt.
Cash Flow Analysis:
Cash flow from operations turned negative in FY23, landing at -₹75.18 crore. A sharp turnaround followed, reaching ₹78.71 crore in FY24 thanks to stronger collections and tighter control on outflows. By FY25, it settled lower but stayed above zero at ₹36.82 crore. The link between rising profits and actual cash coming in looks healthier now.
Key Financial Ratios:
Although debt-to-equity dipped a little in severity, it stays high - about 1.58x by FY23, climbing to 1.63x in FY24 and reaching 1.94x in FY25, roughly based on how net worth is measured. Instead of declining further, return on equity turned positive: hitting 3.73% in FY24 after being below zero before, then jumping to 11.28% later.
5. Key Insights And Interpretation
Strengths:
Since 2019, income has climbed sharply after earlier drops. Year by year, growth turned steady despite past instability. Following setbacks, recent performance shows clear improvement. Profits rose - each period stronger than the one before. After a rough stretch, financial results now reflect consistent rebound.
Profitability resumed following the financial downturn observed in FY23.
• Positive operating cash flow in FY24 and FY25.
• Improved asset utilisation and business scale.
Weaknesses:
Even though profits remain thin, shifts in material costs could easily affect them. Despite small gains, the risk tied to supply prices stays high. With little room for error, market swings might push margins lower. Because expenses hover near revenue, any spike in materials brings pressure. Still below ideal levels, earnings depend heavily on stable input pricing.
Risk Factors:
Commodity prices swinging widely stand out as a concern, while reliance on operating funds adds strain. Pressure from debt loads plays a role, especially when borrowing costs shift even slightly. High ownership concentration among promoters raises questions about oversight balance.
Future Outlook:
If things go well on the volume front - provided margins tick upward without piling on debt - Raj Rayon may keep moving forward. A bit of optimism shows through, yet turning higher sales into consistent profit remains the real test.
6. Conclusion
Turnaround potential defines Raj Rayon Industries Limited more clearly than any sign of settled, long-term growth. Sales, profit, and cash from operations climbed sharply between FY23 and FY25. Yet debt levels stay elevated, while earnings margins remain narrow. Investors comfortable with volatility might see opportunity here - those focused on stability likely will not.
Annual Report / 3-Year Financial Summary Table
Graphics Representation
7. References
Raj Rayon Industries Limited. (2023). Annual Report 2022–23. Retrieved from https://www.rajrayon.com
Raj Rayon Industries Limited. (2022). Annual Report 2021–22. Retrieved from https://www.rajrayon.com
Raj Rayon Industries Limited. (2021). Annual Report 2020–21. Retrieved from https://www.rajrayon.com
Bombay Stock Exchange. (2024). Raj Rayon Industries Ltd. Financial Results. Retrieved from https://www.bseindia.com