Rahul Merchandising Ltd.

- INTRODUCTION
Rahul Merchandising Limited was founded in 1993 as a Delhi-based enterprise. It was a sole-owner operation before evolving into a structured business. Its main work centres on textiles and clothing production. Growth goals drove the shift toward formal organisation. Export expansion and home market activities significantly influenced its direction after incorporation.
- Industry-Overview
- In recent years, the fabric and clothing sector has played a vital role in India's economic structure. Around 2% of the country’s overall GDP comes from this field, which also accounts for nearly 11% of manufacturing output, measured by gross value added, as of the end of 2024.
- Employment on a large scale emerges here - more than 45 million individuals earn income through it.
- Even amid changes in international trade routes, shipments of ready-to-wear clothes saw an increase of about 4.75% compared to the previous year, hitting USD 1.34 billion per month halfway into 2025. Supportive policies introduced by authorities, including incentives under the PLI program and development of PM MITRA industrial zones, now help strengthen its presence abroad. A broader aim behind such efforts involves establishing India as a key destination for worldwide procurement.
- Purpose of the Analysis
This report looks into how financially stable Rahul Merchandising remains amid shifting market demands. It analyses whether current operations can withstand ongoing challenges in the textile MSME sector.
2. COMPANY-OVERVIEW
- Background-History
The journey began with Rahul Industrial Corporation, operating as a sole enterprise dealing in clothing shipments abroad. In 1993, its structure shifted, becoming a publicly listed entity. Through years of steady operation, the business stayed rooted in New Delhi's manufacturing zones, especially areas like Okhla and Vishwas Nagar.
- Business-Model
- Starting with its own production units, Rahul Merchandising combines factory output with outside suppliers’ contributions. Nearly 900,000 pieces of clothing roll out each year under this setup.
- Output targets large-scale demand, both beyond borders and within the country. While internal facilities handle bulk, external partners add needed flexibility.
- Ready-to-wear items make up the core range offered. Production volume supports a consistent supply across channels.
- This blend shapes how orders are fulfilled. Capacity limits stay balanced against market needs.
- Key Products-Services
The core portfolio consists of readymade garments, textile fabrics, and related accessories. Recently, there have been indications of name changes or structural shifts toward "Tacent Projects," suggesting a potential diversification or rebranding strategy.
- Market-Position
Though tiny in scale – with market capitalisation near ₹14.91 crore - the firm holds ground in India’s scattered fabric trade. Instead of chasing mass markets dominated by giants, it focuses on narrow export lanes and compact homegrown retailers. Competition presses hard: informal workshops nearby undercut prices, just as cheap overseas suppliers from Bangladesh or Vietnam do. Size limits reach, yet having a specialisation helps reach success.
3.PROMOTER-FOUNDER INFORMATION
Name of Promoter/Founder | Professional Background | Role in Growth & Strategic Decisions |
|---|---|---|
Suresh Mansharamani | Experienced entrepreneur in the export-import (EXIM) domain. | Founded the original proprietorship; instrumental in taking the company public and establishing early export channels. |
Mohit Sharma | Executive Director with a background in operations and management. | Recently elevated to Whole Time Director (w.e.f. May 2025) to lead day-to-day operational scaling. |
Ankit Tayal | Strategic management professional. | Formerly Executive Director; moved to a Non-Executive role in late 2025 to provide oversight on board-level governance. |
4. FINANCIAL-STATEMENT ANALYSIS
- Income-Statement Analysis
Particulars | FY 2023 | FY 2024 | FY 2025 |
|---|---|---|---|
Revenue from Operations | 0.00 | 0.05 | 3.35 |
Total Expenses | 0.02 | 0.08 | 3.39 |
Net Profit / (Loss) | (0.02) | (0.03) | (0.04) |
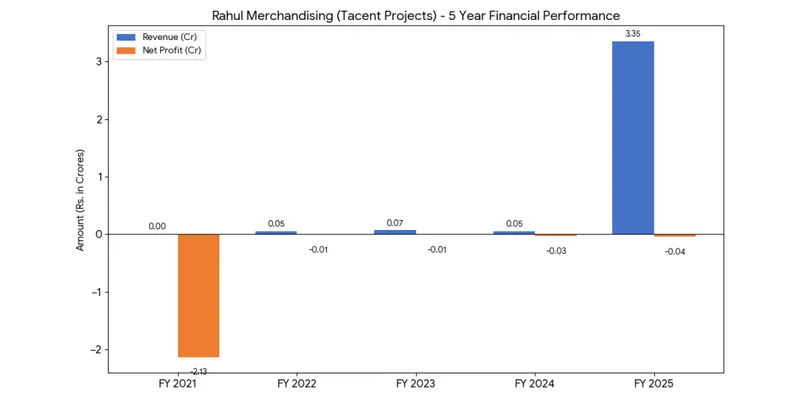
- Revenue Surge: There was a significant jump in revenue in FY 2025 (₹3.35 Cr), suggesting the new consultancy or trading activities have finally commenced at scale.
- Persistent Losses: Despite the revenue increase, the company remains loss-making due to high "other expenses" associated with the restructuring.
- Profitability Gap: The company is struggling to reach a break-even point where revenue covers fixed operational costs.
- Revenue-Chart
- Balance-Sheet Analysis-(Rs.-In crore)
Particulars | FY 2025 |
|---|---|
Share Capital | 3.51 |
Reserves & Surplus | (3.77) |
Total Assets | 3.93 |
Total Liabilities | 4.19 |
Key-observations:
- Negative Net Worth: The reserves are negative (-₹3.77 Cr), meaning the company has eroded its entire equity base through accumulated losses.
- Liquidity Risk: Total liabilities exceed total assets, which indicates a high risk of technical insolvency if creditors demand immediate payment.
- Asset Structure: Most assets are currently liquid or short-term, consistent with a service-based business model.
- Cash-Flow Statement Analysis (Rs. In crore)
Particulars | Amount (Rs. Cr) |
|---|---|
Cash from Operating Activities | (0.10) |
Cash from Investing Activities | 0.00 |
Cash from Financing Activities | 0.11 |
Net Change in Cash | 0.01 |
Key-observations:
- The business is burning cash at the operational level (-₹0.10 Cr), which is typical for a company in transition.
- Survival is currently dependent on Financing Activities, likely through short-term infusions from promoters or directors to meet daily working capital needs.
- Key Financial Ratios for FY25
Ratio | Value | Interpretation |
|---|---|---|
Net Profit Margin | -1.19% | Reflects the inability to turn the new revenue into bottom-line profit. |
Current Ratio | 0.94x | Below the healthy 1.5x-2.0x range; indicates tight liquidity. |
Debt-to-Equity | -1.23x | Mathematically negative due to negative equity; suggests extreme leverage. |
Asset Turnover | 0.85x | Moderate efficiency in utilising the small asset base to generate sales. |
Year-on-Year Comparison (3 years)
Metric | FY 2025 | FY 2024 | FY 2023 | YoY Interpretation |
|---|---|---|---|---|
Total Revenue | 3.35 | 0.05 | 0.07 | 6,600% jump in FY25, indicating a restart of active trading/consultancy. |
Total Expenses | 3.39 | 0.08 | 0.08 | Scaled proportionately with revenue; primarily driven by the purchase of goods. |
Net Profit (PAT) | (0.04) | (0.03) | (0.01) | Losses widened slightly despite higher sales due to thin operating margins. |
Net Worth | (0.26) | (0.22) | (0.19) | Negative Equity: Accumulated losses continue to erode the capital base. |
Total Assets | 3.93 | 0.05 | - | Significant asset buildup in FY25 to support the new business volume. |
Current Ratio | 0.94x | 0.01x | 0.03x | Improved from negligible levels but remains below the healthy 1.5x threshold. |
Debt-to-Equity | -1.23x | -0.70x | -0.80x | Negative ratio confirms the company is technically insolvent (liabilities > assets). |
5. KEY INSIGHTS-INTERPRETATION
- Strengths
Successful rebranding to Tacent Projects and a visible "restart" of revenue generation in FY 2025.
- Weaknesses
Deeply eroded net worth and continuous annual losses; lack of a sustainable profit margin.
- Risk Factors
Highly competitive service sector; dependence on promoter funding; regulatory risks associated with the industry pivot.
- Future Outlook
The company is in a "survival and pivot" mode. Future success depends entirely on whether the consultancy wing can secure high-margin contracts to offset the accumulated losses.
6. CONCLUSION
- Financial Health
The company's financial health is weak and categorised as high-risk. It is currently technically insolvent with negative equity.
- Investment/ Performance Perspective
From a performance standpoint, this is a turnaround play. Investors should exercise extreme caution, as the company needs several quarters of consistent profitability to restore its balance sheet and investor confidence
Data-Sources
https://www.tacentprojects.in/
https://www.screener.in/company/531887/consolidated/
https://economictimes.indiatimes.com/tacent-projects-ltd/stocks/companyid-7366.cms