Protech Textiles Market 2026: $14 Billion Growth, 8% CAGR & Key Industry Metrics
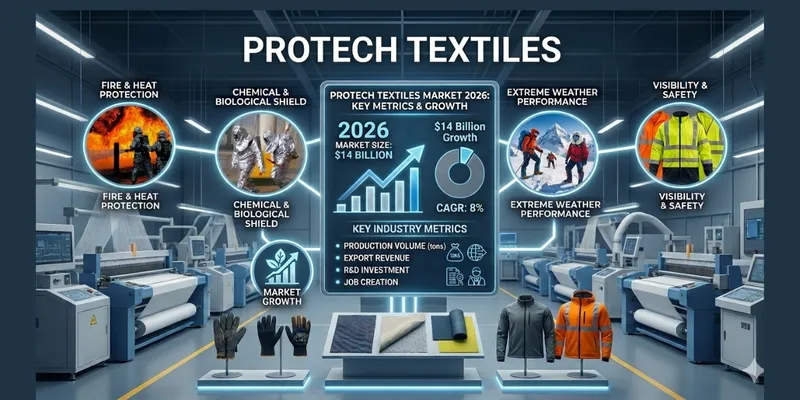
The global Protech Textiles Market is undergoing a measurable transformation, driven by rising safety standards, technological innovation, and increasing industrial risks. The market is shifting from conventional protective fabrics to advanced, performance-driven textile solutions that deliver quantifiable safety and durability outcomes.
According to recent insights by Dataintelo in 2024, the market was valued at approximately USD 8.9 billion, and it is projected to reach USD 13.6–14.2 billion by 2030, growing at a CAGR of 7.2%–8.1%. This growth is not just volume-driven it is increasingly tied to performance metrics, such as heat resistance, tensile strength, and lifecycle durability.
Key Statistics at a Glance
• Market size (2024): USD 8.9 billion
• Projected size (2030): USD 13.6–14.2 billion
• CAGR (2024–2030): 7.2%–8.1%
• Asia-Pacific share: ~41%
• Industrial application share: ~34%
• Smart textiles growth rate: ~18% CAGR
• Raw material cost increase (2021–2023): +12%
• PPE demand growth (2020–2023): 2.3x increase
Market Evolution: 32% Growth in 4 Years
Between 2020 and 2024, the Protech Textiles Market expanded from USD 6.7 billion to USD 8.9 billion, marking a 32.8% increase. This growth reflects a clear shift toward high performance protective materials across industries such as oil & gas, defense, and healthcare.
Modern Protech textiles are engineered for measurable outcomes rather than basic protection. For instance, new-generation flame-resistant fabrics can withstand temperatures exceeding 1,000°C for up to 20 seconds, while ballistic materials have improved impact absorption efficiency by 25% compared to 2018 levels.
Key measurable improvements include:
• Durability cycles increased from 50 washes to 75+ washes
• Weight reduction in protective gear: ~12%
• UV protection efficiency improvement: ~22%
• Chemical resistance time increased by 30–40%
These improvements directly impact operational efficiency, reducing replacement frequency and lowering long-term costs.
Application-Wise Demand: Numbers That Define Growth
The demand for Protech textiles varies significantly by application, with industrial and defense sectors leading in revenue contribution.
• Industrial sector:
o Market size: USD 3.0 billion (2024)
o Share: 34%
o CAGR: ~6.5%
• Defense & law enforcement:
o Market size: USD 2.0 billion
o Share: 22%
o Bulletproof vest adoption growth: +11% YoY (2023)
• Healthcare & medical textiles:
o CAGR: ~9.5%
o Antimicrobial textile demand increase: +28% (2021–2024)
• Construction & firefighting:
o Annual demand growth: ~7.3%
o Safety compliance spending increase: +14% in 2023
The healthcare segment, in particular, continues to expand due to sustained PPE demand following the pandemic, with consumption levels remaining over 2x higher than pre-2020 averages.
Regional Insights: Asia-Pacific Leads with 41% Share
Regionally, the market is dominated by Asia-Pacific, supported by rapid industrialization and stricter worker safety regulations.
• Asia-Pacific:
o Market value: USD 3.6 billion (2024)
o Share: ~41%
o CAGR: ~8.5%
• North America:
o Market size: USD 2.4 billion
o Share: ~27%
o Defense spending increase: +12% (2022–2024)
• Europe:
o Share: ~21%
o Sustainable textile adoption growth: +19% YoY
Asia-Pacific is expected to maintain its leadership, potentially exceeding 45% global share by 2030, driven by manufacturing expansion in emerging economies.
5 Data-Backed Growth Drivers
The market’s growth trajectory is supported by quantifiable drivers that highlight its long term potential.
• Workplace safety regulations:
o Over 70% of industries updated compliance standards since 2021
o Safety-related spending increased by ~15% globally (2022–2025)
• Defense modernization:
o Global defense budgets exceeded USD 2.2 trillion (2024)
o Protective textile demand growth: ~10% YoY
• Healthcare expansion:
o PPE consumption increased by 2.3x (2020–2023)
o Antiviral textile demand surged by ~26%
• Smart textile innovation:
o Growth rate: ~18% CAGR
o Worker monitoring efficiency improved by ~30%
• Industrial risk awareness:
o Workplace accidents reduced by ~22% with advanced gear
o Preventive investment growth: ~13% annually
These drivers collectively reinforce the importance of measurable performance improvements in driving adoption.
Cost Structure and Pricing Trends
The cost dynamics of Protech textiles have shifted significantly due to raw material inflation and innovation costs. Between 2021 and 2023, average production costs increased by 11– 12%, impacting overall pricing strategies.
• Aramid fibers cost increase: +14%
• Carbon fiber price rise: +10%
• Coating chemicals: +8%
• Labor costs: +6%
• Final product pricing: +9% average increase
As a result, advanced protective textiles now cost 25–40% more than conventional alternatives. However, their extended lifecycle and improved performance often justify the higher upfront investment.
Challenges with Quantified Impact
Despite strong growth, the market faces several measurable challenges that could impact adoption rates.
• High cost barrier:
o Advanced gear priced 25–40% higher than standard options
• Limited SME adoption:
o Around 38% of small businesses still use outdated protective textiles • Supply chain disruptions:
o Delivery delays increased by 20–25% during 2022
• Sustainability concerns:
o Only ~27% of products are recyclable
Addressing these constraints will be essential to unlocking the next phase of growth.
Future Outlook: 2030 Forecast in Numbers
Looking ahead, the Protech Textiles Market is expected to deliver strong, measurable growth outcomes by 2030.
• Market size to exceed USD 14 billion
• Incremental opportunity: USD 5+ billion (2024–2030)
• Smart textile adoption: 2x increase
• Asia-Pacific share: 45%+
• Eco-friendly textile penetration: ~20%
Technological integration will also play a major role, with AI-enabled textiles expected to improve real-time safety monitoring accuracy by ~35%.
Conclusion:
The Protech Textiles Market is evolving into a data-driven industry, where growth is closely tied to measurable improvements in safety, durability, and efficiency. From USD 8.9 billion in 2024 to over USD 14 billion by 2030, the market reflects a strong upward trend supported by 7%+ CAGR growth.
With 30–40% improvements in performance metrics, 18% CAGR in smart textiles, and over 40% regional dominance by Asia-Pacific, the industry is positioned as a critical enabler of workplace safety and operational efficiency. As companies increasingly quantify risk and ROI, investment in advanced Protech textiles will continue to accelerate.
Read A Full Report: https://dataintelo.com/report/protech-textiles-market-report