Prashant India Limited

1. Introduction
Prashant India Limited (PRSNTIN) is a tiny BSE-listed company started in 1983 as Prashant Proteins Limited, name changed to Prashant India in 1994–95. Based in Surat, Gujarat, it runs textiles (yarn work at Palsana unit), a 1 MW wind farm in Rajkot, and an agro oil unit in Bhavnagar. Lately, just the wind farm and bits of textiles bring in money.
It's been a rough time. The agro division closed in 1999–2000 from price drops, leading to BIFR referral. Now it has tiny revenue, ongoing losses, low promoter stake at 19.42%, negative book value, and Rs. 34.61 crore debt. Big news in Q2 FY26: sold Palsana land for Rs. 10.20 crore one-time gain; machinery okayed for scrap in Feb 2026.
This report checks background, promoters, and FY22–FY24 finances from Screener.in and BSE only.
2. Company Overview
Background and History
Prashant India Limited started with P.M. Gondalia back in November 1983 as a private company. It went public in September 1985 and raised money through a public issue that same November for expansion. During the 1986–88 Gujarat drought, it switched to agro-exports to survive. In 1994–95, they built a polyester yarn plant at Palsana, Surat, and became big rapeseed exporters. But the agro division shut in 1999–2000, sending them to BIFR.
Business Segments
The Palsana textile unit handled yarn sizing, texturizing, and twisting. A wind farm in Dhank, Rajkot runs five 200 KW generators for 1 MW total. The agro unit in Bhavnagar has an oil mill and extraction facilities, but it's idle. February 2026 board decision scraps all Palsana textile machinery, ending that business for good.
Current Status
Revenue's been almost nothing, Rs. 0.11 crore in FY25. Q2 FY26 land sale at Palsana brought Rs. 10.20 crore one-time gain, pushing quarterly profit to Rs. 10.03 crore. That's just asset sale cash, not real operations. One director quit in February 2026. September 2025 postal ballot changed the memorandum, hinting at new directions, but nothing firm was announced.
3. Promoter Introduction
Promoters hold only 19.42%, way too low for a micro-cap, steady since FY19 at least. Public owns 80.52% across 8,600+ shareholders. Low stake means weak commitment and governance worries. Key board from BSE reports and disclosures:
Name | Designation | Note |
|---|---|---|
P.M. Gondalia | Chairperson & Promoter | Founder; running since 1983 |
Swati Babulal Joshi | Director | Non-executive |
Nishtha Harivanshi Pamnani | Director | Non-executive |
Hiren Shah | Director | Non-executive |
Parth Mahendrakumar Pandya | Director | Resigned Feb 2026 (BSE) |
Shobhaben Rajeshbhai Dudhat | Director | Non-executive |
Table 1: Board of Directors (Source: BSE Annual Report / Disclosures)
19.42% promoter holding screams red flag, healthy micro-caps have 50–75%. Public dominates at 80%+, no big institutions or FIIs (DII just 0.05%). Makes it easy to manipulate prices.
4. Financial Statement Analysis
4.1 Income Statement (FY22 – FY24)
Revenue fell from Rs. 1.04 crore in FY22 to Rs. 0.99 crore FY23, then Rs. 0.30 crore FY24. Expenses beat sales each year, causing nonstop operating losses. Net losses rose from Rs. 0.16 crore to Rs. 0.36 crore. OPM dropped from -9.6% to -123.3%, FY24 operations cost more than twice revenue. No tax paid due to loss carryovers.
Particulars (Rs. Crore) | FY22 | FY23 | FY24 |
|---|---|---|---|
Revenue (Sales) | 1.04 | 0.99 | 0.30 |
Total Expenses | 1.14 | 1.11 | 0.67 |
Operating Profit/(Loss) | -0.10 | -0.12 | -0.37 |
OPM % | -9.6% | -12.1 | -123.3 |
Other Income | 0.04 | -0.03 | 0.10 |
Depreciation | 0.10 | 0.09 | 0.09 |
Net Profit/(Loss) | -0.16 | -0.24 | -0.36 |
EPS (Rs.) | -0.38 | -0.57 | -0.85 |
Table 2: Income Statement Summary — FY22 to FY24 (Source: Screener.in)
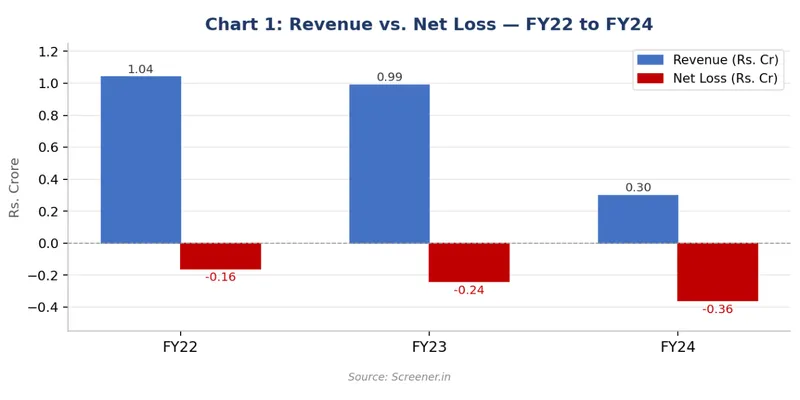
Chart 1: Revenue vs. Net Loss — FY22 to FY24
4.2 Balance Sheet (FY22 – FY24)
The balance sheet shows serious trouble. Assets shrank from Rs. 2.35 crore FY22 to Rs. 1.73 crore FY24, while Rs. 34.61 crore debt stayed flat—way out of line with assets. Reserves were deeply negative for years (-36.65 crore FY22 to -37.25 crore FY24), so losses crushed capital. Book value per share around -Rs. 76 to -78. Fixed assets dropped from Rs. 1.79 crore to Rs. 1.37 crore from depreciation, then Rs. 0.41 crore FY25 after land sale.
Particulars (Rs. Crore) | FY22 | FY23 | FY24 |
|---|---|---|---|
Equity Capital | 4.24 | 4.24 | 4.24 |
Reserves | -36.65 | -36.89 | -37.25 |
Borrowings | 34.61 | 34.61 | 34.61 |
Other Liabilities | 0.15 | 0.09 | 0.13 |
Total Assets | 2.35 | 2.05 | 1.73 |
Fixed Assets | 1.79 | 1.46 | 1.37 |
Book Value/Share (Rs.) | ~-76 | ~-77 | ~-78 |
Table 3: Balance Sheet Summary — FY22 to FY24 (Source: Screener.in)
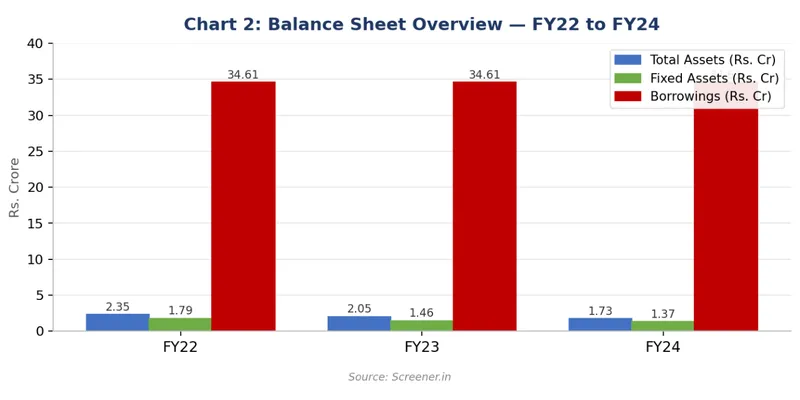
Chart 2: Balance Sheet Overview — FY22 to FY24 (Source: Screener.in)
4.3 Cash Flow (FY22 – FY24)
Operating cash flows got worse. Rs. 0.16 crore outflow FY22, then -0.16 crore FY23, -0.19 crore FY24. FY25 hit -0.90 crore. Investing showed Rs. 1.88 crore inflow FY25 from Palsana land sale. Financing stayed zero every year—no new capital or debt paydown, so Rs. 34.61 crore borrowing just sits there since FY21 at least.
Cash Flow (Rs. Crore) | FY22 | FY23 | FY24 |
|---|---|---|---|
Operating | 0.16 | -0.16 | -0.19 |
Investing | -0.01 | 0.24 | 0.00 |
Financing | 0.00 | 0.00 | 0.00 |
Net Change | 0.15 | 0.08 | -0.19 |
Table 4: Cash Flow Summary — FY22 to FY24 (Source: Screener.in)
4.4 Key Ratios
Ratio | FY22 | FY23 | FY24 | Observation |
ROCE % | -6.58% | -7.69% | -18.54% | Deeply negative |
OPM % | -9.6% | -12.1% | -123.3% | Deteriorating fast |
Debtor Days | 28 | 33 | 122 | Rising sharply |
Working Cap. Days | -12,154 | -12,749 | -42,133 | Meaningless, no ops |
EPS (Rs.) | -0.38 | -0.57 | -0.85 | Persistent losses |
Promoter Holding | 19.42% | 19.42% | 19.42% | Very low |
Book Value/Share | ~Rs.-76 | ~Rs.-77 | ~Rs.-78 | Deeply negative |
Table 5: Key Financial Ratios — FY22 to FY24 (Source: Screener.in)
4.4 Key Ratios Analysis (FY22 – FY24)
ROCE at -18.54% in FY24 means the company destroys capital. Every rupee invested loses money instead of earning returns. OPM fell from -9.6% to -123.3%, showing operating losses exploded faster than revenue shrank, so costs are totally out of control. Debtor days climbed from 28 to 122, customers now take four times longer to pay, bad for near-zero sales. Working capital days at -12,154 to -42,133 aren't real ratios anymore; near-zero revenue just broke the operating cycle completely. EPS doubled losses from -Rs. 0.38 to -Rs. 0.85 with no cost cuts matching revenue drop. Promoter holding locked at 19.42% signals weak commitment, healthy small firms have 50–75%. Book value per share stays deep negative around -Rs. 76 to -78, so losses wiped out equity years ago; liabilities beat assets, making it balance-sheet insolvent. These ratios show no real business left, no earnings, stuck Rs. 34.61 crore debt, and no shareholder equity.
5. Key Insights and Interpretation
Core Problem: Debt vs. Assets
Prashant India's balance sheet shows a huge gap between debt and assets. Borrowings stuck at Rs. 34.61 crore for five years while assets fell to Rs. 1.73 crore FY24 and Rs. 2.57 crore FY25, covering under 10% of debt. Reserves at -Rs. 37.25 crore mean years of losses wiped out all equity.
Negative Working Capital Days
Working capital days from -12,154 FY22 to -42,133 FY24 aren't normal ratios—they just prove near-zero operations broke the business cycle completely.
Land Sale: One-time Lifeline
Q2 FY26 Palsana land sale brought Rs. 10.20 crore, giving Rs. 10.03 crore one-time profit and cutting debt to Rs. 25.10 crore by Sep 2025. Not clear if it paid lenders yet. Feb 2026 board scrapped all textile machinery, ending that business.
Future Outlook
The next steps are totally unclear. Land sale might spark restructuring; memo changes hint at new direction. But revenue near zero, the wind farm barely works, agro idle, no new plans shown. 19.42% promoter stake offers zero confidence. Pure speculation.
6. Conclusion
Prashant India Limited once ran agro-exports and textiles, but it's been sliding for over 20 years. By FY22–FY24, revenue stayed under Rs. 1 crore, operating losses dragged on, and Rs. 34.61 crore debt dwarfed assets below Rs. 2.35 crore—clear insolvency. Book value per share sat negative around Rs. -76 to -78.
The FY26 land sale gave short-term relief, but it's no business fix. Scrapping Palsana textile machinery in February 2026 killed core manufacturing. No solid new plan or debt cleanup means it stays shaky.
Data Sources
1. Screener.in
2. BSE India