OXFORD INDUSTRIES LIMITED
1. Introduction
Oxford Industries Limited (OXFORDIN) lists on BSE as a micro-cap, started December 11, 1980 as L.S. Synthetics Private Limited. Went public in 1990 as L.S. Synthetics Limited, then renamed Oxford Industries. Based in Mumbai, Maharashtra, founded by the Laila family (Kachins Group).
It deals in shirting fabrics, plain, casual, executive, semi-formal under brands like Oxford, Oxford Cotton, Tuscany, Linen, Fiorentina. No factory anymore; just trades sourced fabrics.
FY14–FY22, zero sales, stuck with Rs. 23 crore debt. FY21–22 wrapped One Time Settlements (OTS) with lenders, ditched DRT cases, big one-time gains cleared losses. Trading restarted Q4 FY23.
2. Company Overview
Background and History
Kachins Group traded textiles in Aden and Ethiopia, hit India 1965, set up a Mumbai fashion house. Switched to wholesale shirting 1975. Oxford incorporated 1980, public 1992. The plant did 9 million meters yearly with air-jet looms, rapier machines, and CAD center.
OTS and Revival
FY21–22 nailed OTS deals 'other income' Rs. 11.32 crore FY21, 11.15 crore FY22 from debt haircuts. Borrowings dropped Rs. 23.47 crore FY20 to 1.17 crore FY22. Trading kicked off Q4 FY23. FY24 sales hit Rs. 3.25 crore, tiny but real after nothing.
3. Promoter Introduction
The Laila family (Kachins Group), led by Mazher Nuruddin Laila, held 45.04% since FY16—now selling out completely. New promoter coming in: Saroj Kumar Choudhury. During FY22–FY24, board was:
Name | Designation |
|---|---|
Mazher Nuruddin Laila | Chairman & Managing Director |
Saroj Kumar Choudhury | Incoming Acquirer / Promoter |
Kattakota Satyabati Devi | Executive Whole-Time Director |
Outgoing Chairman & CFO | Resigned |
Table 1: Board and Promoters (Source: BSE Annual Report FY24 / Corporate Announcements)
45.04% stake held steady FY16 to Sep 2025, down to 43.70% pre-SPA. Saroj Choudhury takeover is happening now, March 2026. No pledging ever. Chairman/CFO gone Feb, new director Mar—full transition.
4. Financial Statement Analysis
4.1 Income Statement (FY22–FY24)
No revenue in FY22—business still dead. FY23 saw first sales at Rs. 0.30 crore post-OTS. FY24 hit Rs. 3.25 crore. Expenses took Rs. 3.15 crore FY24, leaving Rs. 0.10 crore ops profit, net Rs. 0.09 crore. OPM at 3.08%, slim but positive after years. All from Rs. 11.15 crore OTS gain in other income, not ops. No dividends. Zero depth, tiny interest.
Particulars (Rs. Crore) | FY22 | FY23 | FY24 |
|---|---|---|---|
Revenue (Sales) | 0.00 | 0.30 | 3.25 |
Total Expenses | 0.11 | 0.37 | 3.15 |
Operating Profit/(Loss) | -0.11 | -0.07 | 0.10 |
OPM % | N/A | -23.3 | 3.08 |
Other Income (OTS gain) | 11.15 | 0.00 | 0.00 |
Net Profit | 11.04 | -0.07 | 0.09 |
EPS (Rs.) | 18.58 | -0.12 | 0.15 |
Table 2: Income Statement — FY22 to FY24 (Source: Screener.in)
FY22 includes Rs. 11.15 Cr OTS debt write-off gain—not from operations
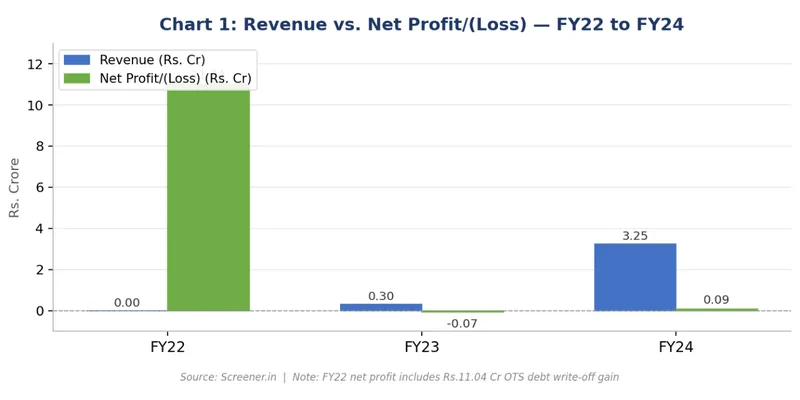
Chart 1: Revenue vs. Net Profit/(Loss) — FY22 to FY24
4.2 Balance Sheet (FY22–FY24)
OTS cleaned up the sheet big time, borrowings plunged from Rs. 23.47 crore FY20 to 1.17 crore FY22, wiping over Rs. 22 crore. Assets stay tiny: Rs. 0.03 crore FY22, 0.20 FY23, 1.04 FY24. No plant means zero fixed assets, low working capital.
Equity capital Rs. 5.94 crore, but reserves deep red at -7.14 to -7.24 crore from old losses. Net worth around -1.20 to -1.30 crore.
Particulars (Rs. Crore) | FY22 | FY23 | FY24 |
|---|---|---|---|
Equity Capital | 5.94 | 5.94 | 5.94 |
Reserves (accum. loss) | -7.17 | -7.24 | -7.14 |
Borrowings | 1.17 | 1.28 | 1.69 |
Other Liabilities | 0.09 | 0.22 | 0.55 |
Total Assets | 0.03 | 0.20 | 1.04 |
Fixed Assets | 0.00 | 0.00 | 0.00 |
Book Value/Share (Rs.) | ~ -2.05 | ~ -2.19 | ~ -2.07 |
Table 3: Balance Sheet Summary — FY22 to FY24 (Source: Screener.in)
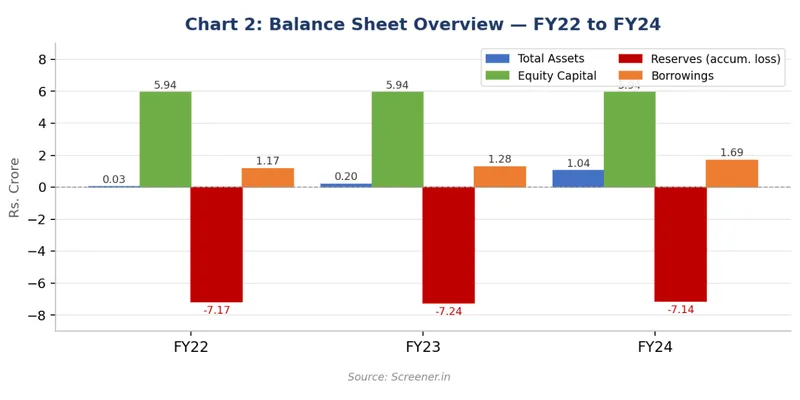
Chart 2: Balance Sheet Overview — FY22 to FY24
4.3 Cash Flow
Cash stays small-scale. Ops cash near zero FY22 (-Rs. 0.03 crore), negative FY23 (-0.11), positive FY24 (+0.12) as trading collected bills. FY25 flipped bad at -0.59 crore—working capital sucked. Tiny financing: Rs. 0.49 crore loans FY25. Net changes basically nothing.
Cash Flow (Rs. Crore) | FY22 | FY23 | FY24 |
|---|---|---|---|
Operating | -0.03 | -0.11 | 0.12 |
Investing | 0.00 | 0.00 | 0.00 |
Financing | 0.03 | 0.12 | -0.02 |
Net Change | 0.00 | 0.01 | 0.10 |
Table 4: Cash Flow Summary — FY22 to FY24 (Source: Screener.in)
4.4 Key Ratios
Ratio | FY22 | FY23 | FY24 | Observation |
|---|---|---|---|---|
ROCE % | N/A | N/A | 42.55% | High on tiny base |
OPM % | N/A | -23.3% | 3.08% | First positive |
Debtor Days | 0 | 195 | 52 | Much better |
Cash Conv. Cycle | 0 | 195 | 52 | Settling down |
EPS (Rs.) | 18.58 | -0.12 | 0.15 | OTS only |
Promoter Holding | 45.04% | 45.04% | 45.04% | Shifting now |
Book Value/Share | ~ -2.05 | ~ -2.19 | ~ -2.07 | Negative losses |
Table 5: Key Financial Ratios — FY22 to FY24 (Source: Screener.in)
5. Key Insights and Interpretation
The OTS Effect — Important Clarification
FY22 net profit Rs. 11.04 crore and EPS Rs. 18.58. Pure OTS debt forgiveness in other income no ops. Sales zero then. Lenders took less than owed, booked as gain. Cut losses from ~Rs. -18 crore to -7 crore.
Revenue Revival — Real but Fragile
Restart Q4 FY23 real: Rs. 0.30 crore FY23, 3.25 FY24 trading. OPM 3.08% positive first time. Debtors down 195 to 52 days, better collections. But FY25 sales to Rs. 2.27 crore, FY26 quarters near zip not holding up.
Future Outlook
Bets on turnaround. Clean sheet with Rs. 1.69 crore debt, known shirting brands. But negative reserves Rs. -7.14 crore, no plant, tiny sales.
6. Conclusion
Oxford Industries Limited spent decades in the dumps—zero revenue, Rs. 23 crore debt, DRT fights, piling losses. FY21–22 OTS flipped that, slashing most debt. Small fabric trading kicked back in. FY24 brought Rs. 3.25 crore sales and 3.08% OPM—first real signs of life in ages.
March 2026's big shift: Laila family exits after 40 years, new promoter group takes over. Stock at Rs. 11.5, way over -2.44 book value, rides pure takeover hype. Still negative net worth, no factory, baby revenues, total unknown ahead.
Data Sources
- Screener
- BSE