Nutech Global Limited

1. Introduction-
Nutech Global Limited - a fabric company that is based in Bhilwara, Rajasthan, has been around for a time- About 41 years now, since 1984. The company is listed on the BSE with the stock code 531304 and also has an ISO 9001:2015 certification. The people at Nutech Global Limited make lots of things like suiting fabric, shirting, uniform cloth and some things for your home, such as home furnishing material.
India's textile industry is one of those sectors that always sounds big on paper - it contributes around 2.5% to national GDP and supports roughly 45 million workers directly or indirectly. In recent times there has been a shift towards man-made fibres (MMF), with MMF accounting for about 77% of global fibre usage. Bhilwara itself is considered the hub of synthetic textiles in India, so the company's location works in its favour. The government also removed import duty on shuttle-less looms recently, making machinery upgrades cheaper for manufacturers like Nutech.
The idea behind this report is simple - look at how Nutech Global performed over three years (FY23, FY24, FY25) and see what the numbers actually say.
2. Company Overview
Started by Mr. Shyam Sunder Mukhija in 1984, Nutech turned to a public limited company in 1994 and took the name Nutech Global Limited in 2000. Location is RIICO Industrial Area in Bhilwara. Production capacity is around 3.6 million metres of fabric per year. No subsidiaries, no joint ventures - just one standalone unit doing everything.
The business works on a straightforward model. They produce fabric in-house, also buy ready fabric, process it, and sell it forward. Customers include garment manufacturers, government departments that need uniform cloth, and export clients. Market cap sits around Rs. 8-9 Cr - firmly micro-cap. Promoters hold 38.22% of shares, and the ISO certification is what gets them access to institutional and export buyers who demand certified vendors.
Product | Where It Goes |
|---|---|
Suiting Fabric | Polyester-Viscose blends for formal suits and blazers |
Shirting Fabric | Everyday shirts - light and breathable material |
Uniform / Dress Material | Used in Schools, government departments, corporates |
Home Furnishing Fabric | Used for Curtains, upholstery, and interior use |
3. Promoter / Founder Introduction
Name | Role |
|---|---|
Mr. Shyam Sunder Mukhija | Founder & Non-Executive Director |
Mr. Rajeev Mukhija | Managing Director |
Mrs. Preeti | Executive Director (Aug 2024 onward) |
4. Financial Statement Analysis
Income Statement - 3-Year View (Rs. Lakhs)
Particulars | FY 2022-23 | FY 2023-24 | FY 2024-25 |
|---|---|---|---|
Revenue from Operations | 3,650.00 | 3,649.30 | 3,510.94 |
Total Expenses | 3,647.34 | 3,648.78 | 3,562.60 |
Profit / (Loss) Before Tax | 3.86 | 2.02 | -49.27 |
Net Profit / (Loss) | +3.97 | -8.15 | -29.12 |
Basic EPS (Rs.) | 0.12 | -0.25 | -0.91 |
Revenue was- Rs. 3,650L in FY23, Rs. 3,649L in FY24, and then a small dip to Rs. 3,511L in FY25. Three years, barely any movement. But what happened to the profit line is a different story. There was a tiny profit of Rs. 3.97L in FY23. That became a loss of Rs. 8.15L in FY24. And then in FY25 the loss jumped to Rs. 29.12L - nearly four times worse. The main reason is finance costs, which crossed Rs. 127L in FY25. When borrowing costs are so high relative to the size of the business, there is almost nothing left as margin.
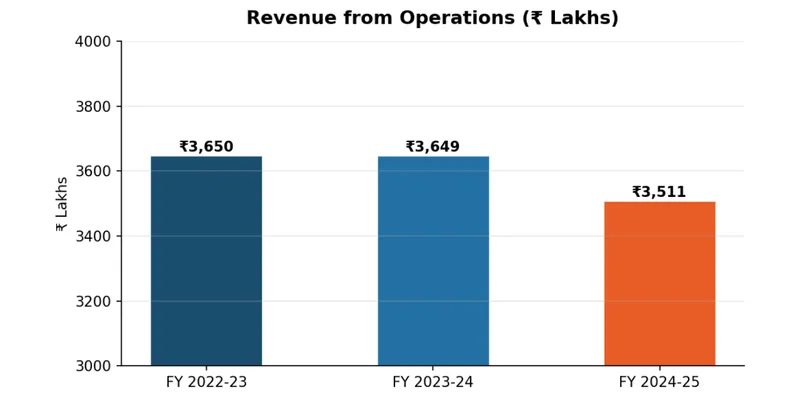
Figure 1: Revenue from Operations
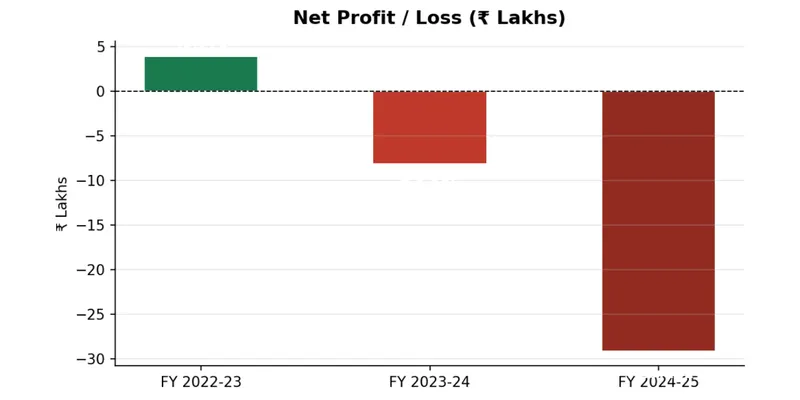
Figure 2: Net Profit / Loss
Balance Sheet (Rs. Lakhs)
Item | FY 2022-23 | FY 2023-24 | FY 2024-25 |
|---|---|---|---|
Total Assets | ~1,763 | 1,779 | 1,834 |
Inventories | ~1,000 | 1,175 | 1,135 |
Cash & Equivalents | 2.09 | 53.50 | 3.38 |
Total Equity | ~617 | 610 | 580 |
Short-Term Borrowings | ~750 | 791 | 894 |
The balance sheet numbers look okay at first glance - total assets went up. But equity has been falling quietly, from around Rs. 617L down to Rs. 580L, because the losses keep eating into reserves. Short-term borrowings went from Rs. 750L to Rs. 894L over three years. The cash number is the one that stands out the most - it crashed from Rs. 53.50L at the end of FY24 to just Rs. 3.38L at the end of FY25. That whole drop happened in a single year.
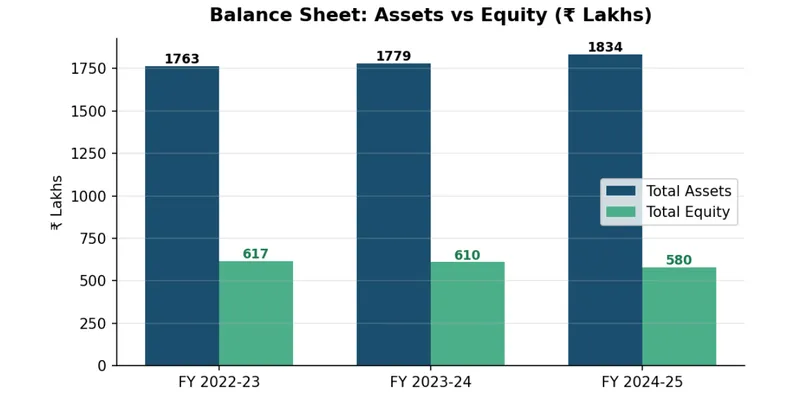
Figure 3: Total Assets vs Total Equity
Ratios
Ratio | FY 2022-23 | FY 2023-24 | FY 2024-25 |
|---|---|---|---|
Current Ratio | ~1.45 | 1.35 | 1.31 |
Debt-Equity Ratio | ~1.80 | 1.92 | 2.16 |
DSCR | ~1.50 | 1.10 | 0.89 |
Net Profit Margin | 0.11% | -0.22% | -0.83% |
ROE | ~0.64% | -1.33% | -4.89% |
Receivables Turnover | ~5.00x | 7.71x | +11.78x |
The DSCR going below 1 - now at 0.89 - is the ratio that stands out the most here. It basically means the company is not generating enough from operations to fully cover its debt payments. ROE at -4.89% confirms shareholders are not getting any return right now. The one ratio that actually improved is receivables turnover, going from around 5x to 11.78x. Customers are paying faster, which is a real positive in an otherwise tough set of numbers.
5. Key Insights & Interpretation
Strengths
The export number is what stands out - revenue from overseas went from Rs. 59L to Rs. 123L in a single year, which is a 108% jump. That kind of growth is hard to ignore. Add to that 41 years of continuous operations, a clean audit report every year, and the ISO certification, and there is clearly something the company is doing right on the operational side.
Weaknesses
The losses have nearly quadrupled in two years. Cash is almost gone. Revenue has not increased at all in three years. There are only 19 permanent employees, which limits how much the company can scale. Finance costs alone are eating up whatever operating margin was left.
Risk Factors
Risk | Level |
|---|---|
DSCR under 1 - debt repayments already strained | HIGH |
Cash at Rs. 3.38L - barely a buffer for anything | HIGH |
Online retail and fast fashion putting pressure on margins | HIGH |
Polyester/viscose yarn prices can be volatile | MEDIUM |
Growing exports also means growing currency exposure | MEDIUM |
Future Outlook
In the annual report, management said FY26 should see things get back to normal. There is some early data to support that - Q2 FY26 (September 2025 quarter) showed sales of Rs. 15.19 Cr and a net profit of Rs. 0.17 Cr. First profit in several quarters. Exports are clearly the part of the business driving growth forward, and that trend looks like it should continue.
6. Conclusion
Area | Where Things Stand |
|---|---|
Revenue | Flat for 3 years - zero real growth |
Profitability | Getting worse - FY25 loss nearly 4x of FY24 |
Cash / Liquidity | Almost zero - very thin margin for error |
To be honest, Nutech Global is not in good financial shape right now. The losses, near-zero cash, and heavy borrowings make that clear. But the company has been running for 41 years - that does not happen without some resilience. The export growth is real, and the early FY26 numbers show some recovery is beginning. The problem is there is very little room for error at this point. Anyone tracking this stock should wait and watch for at least two or three straight profitable quarters before drawing any firm conclusions. One good quarter alone is not enough to call a turnaround.
Sources: Nutech Global Annual Report FY 2024-25 (BSE Filing) Screener.in Company Website