By Susmita Ghosh
The textile and apparel industry is a vital sector of India’s economy, contributing significantly to employment generation and export earnings. The trends in imports and exports of fabrics in India play a crucial role in shaping the dynamics of this industry. India’s export value for 2022-23 was Rs 362,063,094.86, compared to Rs 314,702,149.28 in 2021-22. Similarly, for imports India’s total value stands at Rs 573,395,859.64 in 2022-23 compared to Rs 457,277,458.91 in 2021-22. The value of India’s exports and imports in 2023-24(Apr-Jun) stands at Rs 113,836,644.90 and Rs 175,229,305.66, respectively. Having said that, let’s have a look at the country’s position in exports and imports related to fabrics.
India’s Fabric Export Trend
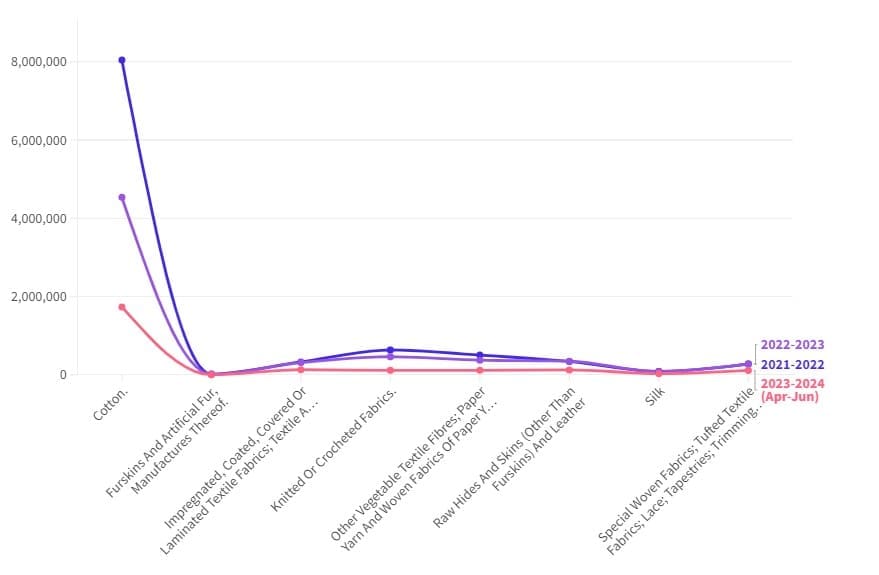
Fig 1.1: India’s Fabric Export Data (Graph Format) *
Source: Trade Statistics, Ministry of Commerce, GOI
| Commodity | 2021-2022 (Rs) | 2022-2023(Rs) | 2023-2024(Apr-Jun) |
| Cotton | 8,043,453.61 | 4,534,888.93 | 1,735,180.43 |
| Furskins and Artificial Fur (Manufactures) | 17,826.02 | 11,869.24 | 3,058.26 |
| Impregnated, Coated, Covered or Laminated Textile Fabrics; Textile Articles for industrial use. | 330,335.88 | 312,899.32 | 130,822.05 |
| Knitted or Crocheted Fabrics. | 633,974.89 | 461,096.15 | 113,003.30 |
| Other Vegetable Textile Fibres; Paper Yarn and Woven Fabrics of Paper Yarn. | 503,460.56 | 374,063.05 | 115,257.87 |
| Raw Hides and Skins (Other Than Furskins) and Leather | 340,743.00 | 346,836.56 | 124,618.37 |
| Silk | 86,703.59 | 81,168.05 | 30,750.64 |
| Special Woven Fabrics; Tufted Textile Fabrics; Lace; Tapestries; Trimmings; Embroidery. | 275,892.50 | 278,403.40 | 111,229.16 |
Fig 1.2: India’s Fabric Export Data (Tabular Format) *
Source: Trade Statistics, Ministry of Commerce, GOI
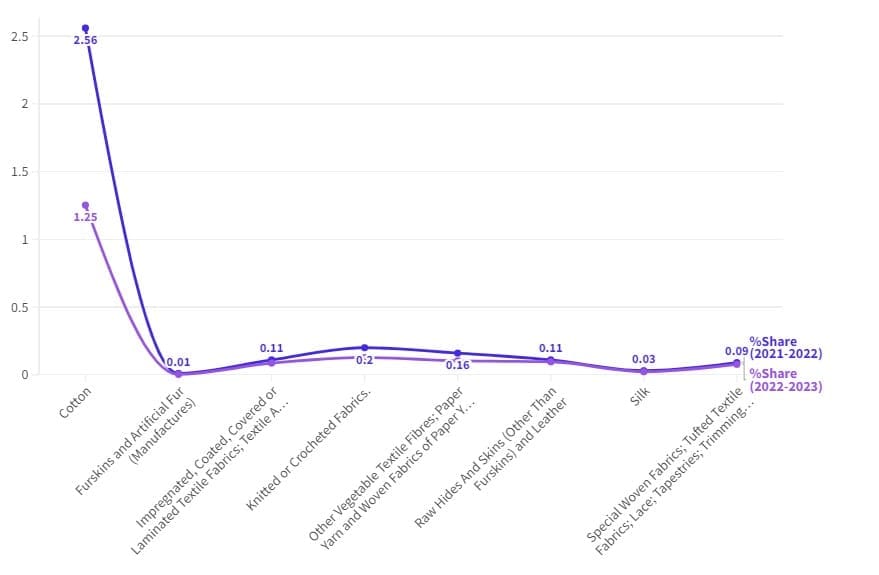
Fig 1.3: India’s Fabric Export % Share (Graph Format) *
Source: Trade Statistics, Ministry of Commerce, GOI
India’s Fabric Import Trend
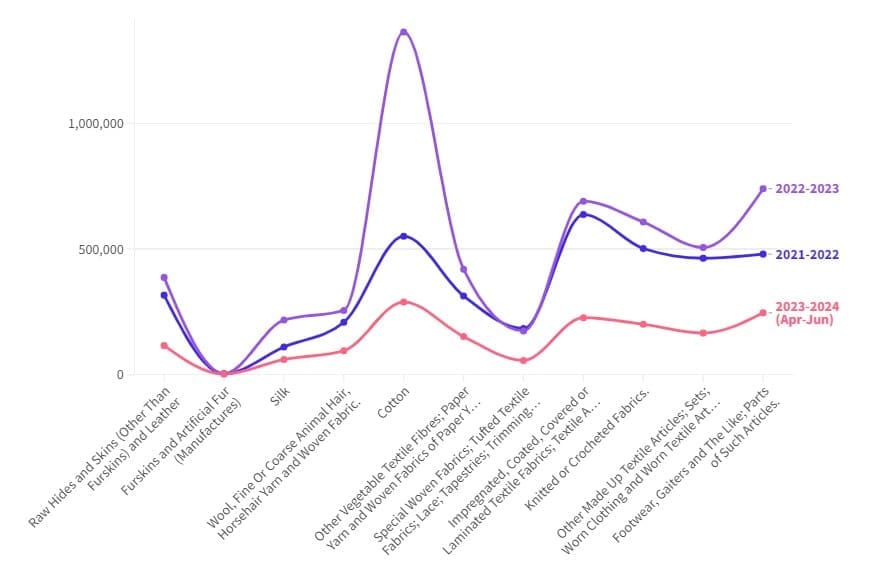
Fig 2.1: India’s Fabric Import Data(Graph Format) *
Source: Trade Statistics, Ministry of Commerce, GOI
| Commodity | 2021-2022 (Rs) | 2022-2023(Rs) | 2023-2024(Apr-Jun) |
| Raw Hides and Skins (Other Than Furskins) and Leather | 316,488.17 | 386,928.34 | 116,110.95 |
| Furskins and Artificial Fur (Manufactures) | 4,011.16 | 4,794.05 | 2,857.57 |
| Silk | 110,486.66 | 217,381.74 | 61,154.09 |
| Wool, Fine Or Coarse Animal Hair, Horsehair Yarn and Woven Fabric. | 208,429.17 | 255,919.62 | 95,566.09 |
| Cotton | 550,826.59 | 1,362,869.42 | 289,143.10 |
| Other Vegetable Textile Fibres; Paper Yarn and Woven Fabrics of Paper Yarn. | 313,563.38 | 419,930.96 | 151,869.22 |
| Special Woven Fabrics; Tufted Textile Fabrics; Lace; Tapestries; Trimmings; Embroidery. | 184,017.53 | 174,419.13 | 57,119.27 |
| Impregnated, Coated, Covered or Laminated Textile Fabrics; Textile Articles suitable for industrial use. | 636,871.89 | 690,095.96 | 227,122.50 |
| Knitted or Crocheted Fabrics. | 502,222.64 | 607,397.14 | 200,670.57 |
| Other Made Up Textile Articles; Sets; Worn Clothing and Worn Textile Articles; Rags | 463,300.08 | 506,014.45 | 165,915.08 |
| Footwear, Gaiters and The Like; Parts of Such Articles. | 479,751.01 | 739,771.13 | 246,458.64 |
Fig 2.2: India’s Fabric Import Data (Tabular Format) *
Source: Trade Statistics, Ministry of Commerce, GOI

Fig 2.3: India’s Fabric Import % Share (Graph Format) *
Source: Trade Statistics, Ministry of Commerce, GOI
India’s Fabric Export and Import Growth Trends
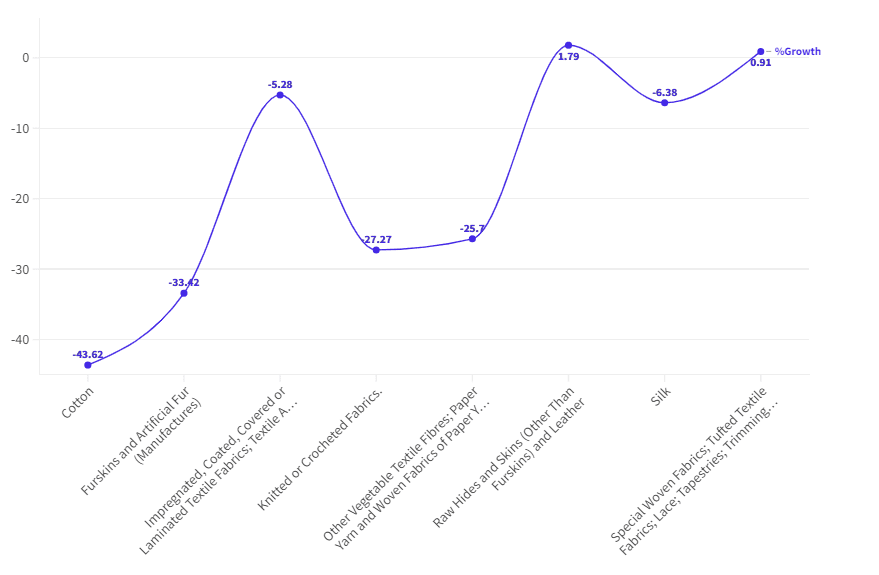
Fig 3.1: India’s Fabric Export % Growth (Graph Format) *
Source: Trade Statistics, Ministry of Commerce, GOI

Fig 3.2: India’s Fabric Import % Growth (Graph Format) *
Source: Trade Statistics, Ministry of Commerce, GOI
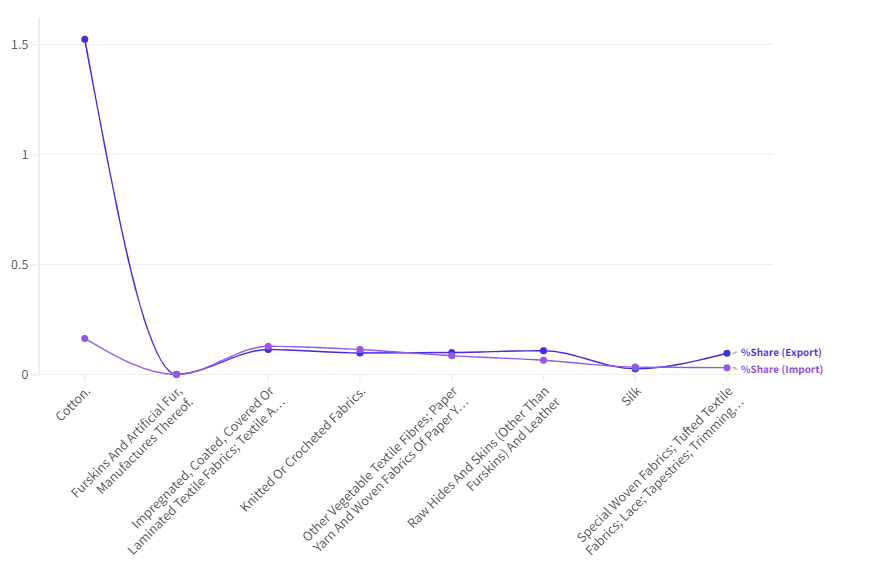
Fig 3.2: India’s Fabric Export and Import % Growth 2023-24 from April to June (Graph Format) *
Source: Trade Statistics, Ministry of Commerce, GOI
| Commodity | %Share (Export) | %Share (Import) |
| Cotton. | 1.5243 | 0.165 |
| Furskins And Artificial Fur, Manufactures Thereof. | 0.0027 | 0.0016 |
| Impregnated, Coated, Covered Or Laminated Textile Fabrics; Textile Articles Of A Kind Suitable For Industrial Use. | 0.1149 | 0.1296 |
| Knitted Or Crocheted Fabrics. | 0.0993 | 0.1145 |
| Other Vegetable Textile Fibres; Paper Yarn And Woven Fabrics Of Paper Yarn. | 0.1012 | 0.0867 |
| Raw Hides And Skins (Other Than Furskins) And Leather | 0.1095 | 0.0663 |
| Silk | 0.027 | 0.0349 |
| Special Woven Fabrics; Tufted Textile Fabrics; Lace; Tapestries; Trimmings; Embroidery. | 0.0977 | 0.0326 |
Fig 3.4: India’s Fabric Export and Import % Growth 2023-24 from April to June (Tabular Format) *
Source: Trade Statistics, Ministry of Commerce, GOI
Takeaway
The trends in imports and exports of fabrics have far-reaching implications for India’s textile industry. Staying informed about these trends and adapting to changing market dynamics are essential for businesses to remain competitive and contribute to the growth of the textile sector in India.
* The fabric-related commodities are within the Top 100 2-level commodities as mentioned in the Ministry of Commerce website, Government of India, as of September 2023. The values are given in Indian Rupees (Rs).

