One of the most common problems to solve in the dye related industries is that of determining the strength of a dye relative to that of another one used as standard. Everyone is aware of the economic importance of this color related property of the dye. The strength is defined as dyer has to use ‘ X’ parts of test dye ‘B’ to obtain an identical coloration to that obtained with 100 parts of the standard dye ‘A’. If dyes are physically or chemically identical, then the strength of the test colorant will be weaker or stronger. This comparison is correct if you are buying dye from the same manufacturer. When two dyes are different, at least in part, chemically or physically or both (say different dyes of same hue or same dyes of different manufacturers), then the strength comparison becomes complicated. Not only the strength but chromatic changes (tonal variations) have also to be considered.
Dye applications and pigment applications are quite different and one has to analyze it differently. Color strength value of pigments is defined as its ability to impart color to other materials. The lower the concentration of a colored pigment required to achieve a defined impression of color that is a given depth of a shade, the greater is color strength of colored pigments. It depends on the absorption coefficient (K) of colorant. The higher the absorption coefficient, the higher will be the strength of colorants, on the other hand, reducing power of TiO2 white (Tinting Strength of white) depends on the scattering coefficient (S). More the scattering, better will be reducing power. Black scatters least and absorbs most, while white scatters most and absorbs least. Some of the pigments such as yellows, reds and oranges scatter a lot and one cannot neglect their scattering power. One has to use both the optical parameters (K and S).
The complicated problem of strength assessment is simplified by color strength calculation.
Testing is made against a specimen of the identical colorant which has been stated as being the standard or reference; it is to be tested as per the procedure recommended and close to coloring process. While evaluating the strength, the same procedure is to be followed for making samples of the standard and the batch simultaneously.
Strength of any colorant (dyestuff / pigment) is related to absorption property. We measure reflectance and not absorbance. It is known to us that when reflectance is more, absorbance is less and when reflectance is less, absorbance is more. Kubelka – Munk theory gives us the following relation between reflectance and absorbance:
K/S = [{(1-R) 2 / 2R}]
Where R is the reflectance, K is absorbance and S is the scattering. K/S Vs Wavelength curve is always characteristics of every colorant.
Color Strength is defined as:
Color Strength = [(K/S) Batch / (K/S) Standard] x 100
One can determine color strength using following different methods:
- R Min(Absorbance Maxima)
- At given Wavelength
- Based on Tristimulus Values.
– X
– Y
– Z
– X & Y (Average)
– Z & Y (Average)
- Integrated Wavelengths.
There is too much confusion in selecting the method for strength calculation. One has to choose the method with great care.
R Min
One can find the lowest value of R (which is maximum value of absorbance) and obtain K/S values of sample and the standard and compute the strength. This is generally accepted and more or less agrees with visual observation. In most of the available color software packages, it is automatically done by the program. Fig.1 illustrates the strength computed at RMin.

Figure 1: Color Strength at R min
Given Wavelength
This option is selected when you are comparing two dyes or pigments, which may be having different R minima. In such cases, you have to compute the strength based on R Min wavelength of the standard. This will give you the correct picture of the strength. If the Standard is manufactured by one company and the incoming dye lot is manufactured by different company then R Min will be different for the two. In such case, we have to use the R Min wavelength of the Standard for the computation of strength. That is called the strength at given wavelength. It is illustrated in Fig.2.

Figure 2: Color Strength at Given Wavelength
Tristimulus Value
This option is used when you are having measurement with colorimeter having three filters. If colorants are Red / Green, then use the ratio of X – Tristimulus value and if colorants are Yellow / Blue, then use ratio of Z – Tristimulus values. If you want to consider the light / dark property of colorants then use the ratio of Y Tristimulus values. It is ideal to use combinations such as average of X and Y (for Red / Green) and Z and Y (for Yellow/ Blue). This will take into consideration the effect of lightness/darkness. In case of Black and White colorants, one can use the ratio of Y -tristimulus value. This method is not much useful in dye application. But in case of pigment application, it is found very useful for high Chroma yellow, red and orange pigments. Figure 3 is the output for the strength based on X value, Figure 4 is based on Y value and Figure 5 is based on Z value.
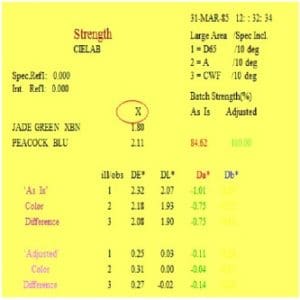
Figure 3: Color Strength calculated using X – Tristimulus Value

Figure 4:Color Strength calculated using Y -Tristimulus Value

Figure 5: Color Strength calculated based on Z- Tristimulus Value
Integrated Wavelength
Some of the laboratories and available color software packages are using integrated wavelength approach for computation of strength. In this case strength is calculated at each wavelength and average is taken as real strength of the colorant. This is becoming more and more popular. Sometimes, it may not give correct strength idea of the colorant as reflectance values are changing wavelength to wavelength. Strength at R Min is the correct representative but strength based on integrated wavelength is preferred by most of the users. In case of mixture dyes, it is found very useful. This is useful if the dye is a mixture dye such as brown, black, orange and olive.
The results of various calculations will differ. The choice of mode of calculations depends on the user’s experience in specific cases. The true answer could be based on perception of equality of depth. One has to obtain extensive visual determinations of the perception of equality of depth. This is a major problem in visual assessment of depth. One must be very careful while interpreting the data.
One can also look at the color difference and hue change (h- Hue angle). Using CIE Diagram (x, y), one can find out the purity and dominant wavelength. If there is no change in dominant wavelength, then there will be no hue change in dyes which are compared.
It is my opinion that in case of textile application, Saunderson correction is not required but we have to use the same in pigment applications.
Strength and Color Difference Relationship
One has to look at the strength and color difference “AS IT IS” and “AFTER ADJUSTMENT” of strength. This is based on mathematical calculation .After adjustment of strength, it may be acceptable but color difference will be too much or strength may not be acceptable but color difference will be within tolerance limit. This is illustrated in Figure 6.

Figure 6: Color Difference” As it is”and” After Adjustment”
Many times, you may get higher strength of colorants. Generally, when the strength of the dye is high, you can adjust it by loading less. Taking this practical approach into consideration, mathematically you can predict the reflectance / absorbance curve of any given sample and predict the expected color difference after adjustment of the strength. Most of the color software packages give data on strength and color difference” AS IT IS” and strength and color difference data “ After the Adjustment”.
Fig. 6 illustrates the computer output for the strength. One can see that strength of the dye is 110.69 with a color difference of 1.97. After adjusting the 10.69% of the strength, color difference will reduce to 0.95 units from 1.97. This may be acceptable. Sometimes, you may find increase in color difference value after adjustment of the strength. That will create more problems for the dyer. One should remember that one has to take into consideration both the parameters, strength and color difference. One must fix a tolerance limit for the strength and also note that color difference of the batch after adjustment of the strength should be within required tolerance limit.
Figure 7 illustrates the dye strength calculations using different methods mentioned above. Jade Green Standard and batch samples of 1% concentration were measured and dye strength was calculated using different methods. In this particular case variation was not significant but it is noticed that strength value is different for different methods. The author’s experience is that the strength at Rmin is always a correct representative.

Figure 7: Dye Strength Calculation using Different Methods
Dye Application (Textiles)
In case of textile application, substrate material scatters and dye absorbs. When we want to compare strength of a dye, we have to dye standard and batch using the same substrate with same concentration and exactly the same dyeing method. As substrate is constant, we can easily compare the color strength as mentioned above.
Many times, dyers make an assumption that if the in-coming batch of the dye is having higher strength (say, 5 to 10 % more), they will be able to reduce the cost of dyeing. The fact is that they will not get the matching in first shot and adjustment will be difficult. Let us say, you have three dyes in a combination (Red, Green and Blue). Batch Red is greener and 10 % strong, batch blue is redder and 5% weak and Green is yellowish and 3 % strong. In such situation, you will adjust the formula using the strength computation but color difference cannot be adjusted and you have to reformulate the recipe. One has to control the strength and color difference. The problem of lightness/ darkness is noticed in some cases. As the sample is darker, one feels that it is deeper in strength. Dirty tone does not mean that it is deeper or stronger. This creates confusion.
There are problems when you are comparing similar dyes manufactured by different manufactures. Colorants are produced from chemical intermediates and by different production processes. The purity of the products used, the process of synthesis and subsequent finishing determine the properties of products. Global salts used in the process play very important role in final strength of the dye produced. It is well known that different dye lots of varying properties are blended and global salts or diluents are used for adjusting higher tint values .Mixture dyestuff are also made from waste by dye manufacturer. All these affect the final color quality and mainly strength is affected to a large extent.
If the same dye is manufactured by different manufacturers, one should look at R min of these two lots and if it is not the same, then use the R min of the standard for computation of strength. Generally, if R min is different, it is Hue difference between the two lots. This can be confirmed by finding out the dominant wavelength from CIE diagram. If it is significantly different say, about 2-3 nm wavelength difference, then it is to be considered as a new dye. It may be due to different chemical constituents used in the process.
The dyestuff manufacturers can always adjust the strength of batches as they are mixing lots of different production batches having different strength. They also use global salts or diluents for reducing the strength if it is on higher side. One should fix a tight tolerance limits for strength and chromaticity. For textile processor, there is no alternative left but to reject the lot or reformulate all those shades which are to be matched with batch lots. Every textile dye house should demand a quality assurance certificate from the colorant manufacturer. If this is done, major problems of dyers are solved. During my industrial experience, I have found a few colorant manufacturers who used to give quality assurance certificate for each dye lot produced and supplied. It was assured that strength is +/- 2 % and tonal variation (color difference) is within accepted tolerance limits. Supplier used to send color data by fax or e-mail. It is quite in advance before the colorant lot is received by the factory. This has solved many problems at both ends. Very stringent control of incoming colorant lots leaves the colorant manufacturer no other choice but to supply colorants with acceptable tolerance limits. Colorant manufacturers will certainly extend their cooperation as they are dependent on buyer. You must request for spectrophotometric curves of each dye supply. This will also reduce the load on lab analysis.
One can look at the variation noticed in in-coming batches of dye lots. Figure 8, illustrates the statistical data of 70 batches of the dye received by the Dye House. The Figure 9 clearly indicates variation in strength and color difference. This statistical data is reported by P Ravichandran and I am using this information for explanation.

Figure 8: Statistical data on Strength of Dye Lots

Figure 9: Statistical data on Strength of Dye Lots
Remember, you must “Look and Think”. Look into sample visually and interpret the data of color strength and chromaticity carefully, otherwise you will be in trouble. In order to avoid corrections in production, one must control the strength and chromaticity of colorants.