New Light Industries Limited

- INTRODUCTION
Starting back in 1995, New Light Industries Ltd. - once known as New Light Apparels Ltd. - runs on the Bombay Stock Exchange as a small publicly traded firm. Textiles roll out of its factories alongside school uniforms, both sold and shipped overseas. Home appliances also form part of what it builds and moves into global markets. Though tiny in market size, its presence stretches beyond local borders through trade networks.
- Industry-Overview
A big part of India's money comes from making clothes and fabrics - about 2.3% of all economic activity ties back here. This area pumps out 7% of what factories across the country produce. On the global front, it accounts for one out of every eight dollars earned through exports. Fierce competition runs deep, with major companies on one side, while countless small operators work separately without much structure.
- Purpose of the Analysis
Looking at how well New Light Industries can pay its bills, run smoothly day to day, while also weighing whether putting money into it makes sense - using their latest financial reports and where they stand in today’s market landscape.
2. COMPANY-OVERVIEW
- Background-History
Starting out as New Light Hosiery Manufacturing Works, a small partnership, things shifted in 1995 when it became a corporation. Right after going public, machine count climbed - jumping from 59 to 84 automated units - to lift sock output fast.
- Business-Model
Running mostly behind the scenes, the firm focuses on producing and moving large quantities of goods between businesses. Instead of owning factories, it leans hard on supplier networks while handling big purchase commitments from institutions. Not built around stores or shoppers, its engine runs on volume deals that demand constant cash flow for operations. Heavy order cycles define how money moves through the system each month.
- Key Products-Services
Out there, custom corporate outfits take shape alongside school gear. Uniforms roll out daily, built for teams and classrooms alike. Sportswear follows its own path - flexible, ready. Woolen sweaters come next, woven thick for cold stretches. Traditional clothing holds space too, stitched with care. Socks appear in batches, practical down to the last thread. Safety equipment wraps it up, made tough for rough jobs.
- Market-Position
Worth around ₹10.8 crore, it barely registers on the scale. Among textile sellers, it sits near the bottom. Big players such as Trident set prices it cannot match. Facing informal rivals who slash costs, it finds little room to move. Power to influence price? Almost none.
- PROMOTER-FOUNDER INFORMATION
Name of-Promoter(s) /-Founder(s) | Professional Background | Role in Company Growth and Strategic-Decisions |
|---|---|---|
Gurcharan Lal | Built career in hosiery and clothing production | Helped shift business into a corporation and scale operations |
Amrik Lal Makkad | Experience in textile manufacturing | Co-led transition and expansion during early corporate stage |
Himanshi Sharma | Finance and corporate management expertise | Managing Director & CFO: Handles financial restructuring, compliance, and strategic recovery. |
- FINANCIAL-STATEMENT ANALYSIS
- Income-Statement Analysis
Particulars (₹ in Crores) | FY21 | FY22 | FY23 | FY24 | FY25 |
|---|---|---|---|---|---|
Revenue from Operations | 19.87 | 6.19 | 6.11 | 12.05 | 17.25 |
Net Profit / (Loss) | 0.02 | -1.21 | -0.52 | 0.37 | 1.14 |
- Revenue-Chart
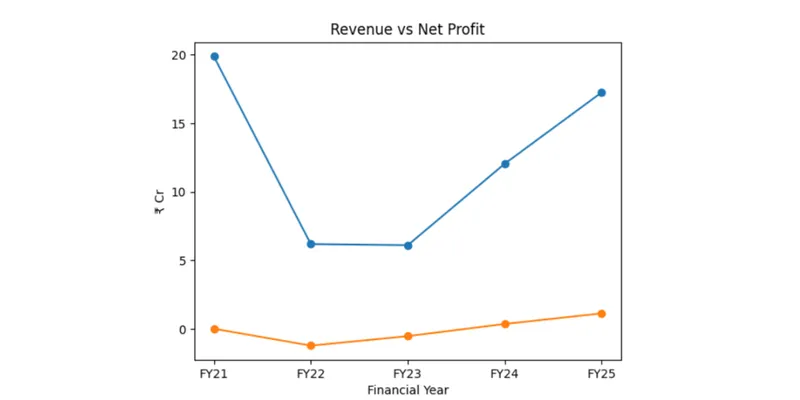
Key-observations:
- Numbers shift from 2023 into 2024, then onward. Year after year moves forward differently. Each column holds its own amount. Data updates when time passes. Values rise or fall without warning. Past figures stay fixed once recorded. Future amounts remain unclear still.
- Another factor shows up later. This detail follows naturally. Something else appears nearby. It fits without force. A different piece sits close by. Each part stays in place. Nothing moves too fast.
- Balance-Sheet Analysis-(Rs.-In crore)
Particulars | FY21 | FY22 | FY23 | FY24 | FY25 |
|---|---|---|---|---|---|
Total-Assets | 12.41 | 11.47 | 11.31 | 11.33 | 14.91 |
Total-Liabilities | 8.52 | 8.80 | 9.58 | 8.02 | 0.52 |
Total-Equity | 3.89 | 2.67 | 1.73 | 3.31 | 14.39 |
Key-observations:
- Now down to ₹0.52 Cr in FY25, external liabilities were still at ₹8.02 Cr the year before. A sharp drop happened outside as debts got cleared fast.
- Jumping to ₹14.39 Cr in equity by FY25 suggests big shifts inside the company. That kind of rise often points to fresh funding or major ownership changes. Not every year sees numbers swing this hard - something clearly shifted under the surface.
- Cash-Flow Statement Analysis (Rs. In crore)
Cash Flow Component | Value | Interpretation & Key Bullet Points |
|---|---|---|
Cash from Operations | -₹7.00 Cr | • The business is bleeding real cash despite showing a net profit on paper. • Indicates severe underlying operational inefficiency. |
Working Capital Changes | -₹8.08 Cr | • The primary driver of the negative cash flow. • Skyrocketing trade receivables mean cash is stuck with clients who haven't paid. |
Capital Expenditure | ₹0.00 Cr | • Virtually zero reinvestment into physical manufacturing assets or capacity expansion. |
- Key Financial Ratios for FY25
Category | Ratio Name | Value |
|---|---|---|
Profitability | Return on Equity | 12.73% |
Liquidity | Current-Ratio | 24.2x |
Leverage | Debt-to-Equity | 0.00x |
Efficiency | Debtor Days | 183 Days |
Year-on-Year Comparison (3 years)
A sharp rise shows up in the Return on Equity figure, now at 12.73 percent - yet behind this lies paper profit without real cash backing. Despite a Current Ratio hitting 24.2 times, comfort fades once you see most of ₹14.56 crore in assets can’t be quickly turned into cash due to overdue bills. Customers take their time paying, dragging Debtor Days to 183; such delays expose weak control during deal negotiations.
5. KEY INSIGHTS-INTERPRETATION
- Strengths
A rock-solid financial base - zero debt on the books. With no loans hanging overhead, there is no danger of collapsing under missed payments. This freedom creates space to move without pressure. Stability comes from having nothing owed.
- Weaknesses
Here lies a firm that turns profit on paper but loses actual money - cash keeps draining out, ₹7 crore gone through operations alone. A broken cash cycle screams trouble loud enough to catch anyone's ear. Leaders hold barely more than five percent of shares, which feels like steering a ship without staying aboard it. Confidence wavers when those in charge own so little skin in the game.
- Risk Factors
That 183-day wait to get paid. When cash comes in that slow, especially in fabric deals, money often vanishes before it lands. This tiny company trades in a shaky zone - prices jump without warning. Thin trading opens doors, inviting sharp players to twist the market their way.
- Future Outlook
Stuck payments are freezing progress. Without clearing those, growth stays frozen. Plans to branch out sound hollow when cash keeps bleeding. The board talks of change, yet nothing moves on the ground. Moving forward hinges on turning overdue invoices into actual funds. Empty promises won’t fix a broken flow.
6. CONCLUSION
- New Light Industries seems strong at first glance - rising revenue, no debt - yet something feels off beneath the surface. Cash that should be flowing through operations sits trapped elsewhere. Profits on paper vanish when real money fails to show up. What looks like success turns hollow without actual funds moving. Numbers inflate while wallets stay empty.
- Here sits a stock underpriced on paper - trading at just 73% of book value. Yet cash keeps bleeding from operations, raising red flags. Money owed to it piles up without clear recovery. Risks stack high enough to scare off any careful buyer. Value looks real until you look closer. Danger lives beneath the surface.
Data-Sources
https://newlightindustries.com/
https://www.screener.in/company/540243/