Metro Brands Limited
1. Introduction
A leading name in India’s shoe retail space, Metro Brands Limited runs shops selling footwear, handbags, and related items for adults and kids. Products sold under homegrown brands like Metro, Mochi, Walkway, and Da Vinci sit alongside global ones such as Crocs, Skechers, FitFlop, and Foot Locker.
1.2 Industry Overview
One out of every five shoes sold in India now comes from a recognised brand. As household earnings climb, city dwellers increasingly choose consistent quality over loose market finds. Though small vendors still hold ground, their share slips year by year. Standing where demand meets access, Metro Brands bridges affordability with trusted labels.
1.3 Purpose of This Report
This report takes a simple, beginner-friendly look at Metro Brands — its history, business, promoters, and 3 years of real financial data from Screener.in and BSE India — to help you understand how the company is performing.
2. Company Overview
2.1 Background & History
A shoe store began in Colaba, Mumbai, back in 1955 - founded by Malik Tejani, inspired by the well-known Metro Cinema close by. Growth unfolded slowly at first, expanded steadily across years, nationwide. By December 2021, shares debuted publicly through an IPO.
2.2 Business Model
Outsourcing every shoe, skips factory ownership entirely. Instead of handling production directly, oversight becomes the main task. Franchise spots differ - local operators take charge there. Digital reach extends through official websites alongside online marketplaces.
2.3 Key Products & Services
Metro Brands offers:
• Own brands: Metro (formal/casual), Mochi (trendy/fashion), Walkway (value), Da Vinci & J. Fontini (premium)
• Partner brands: Crocs, Skechers, FitFlop, Clarks, Foot Locker, Fila, Puma, Adidas
• Accessories: bags, belts, wallets, socks, shoe-care products
2.4 Market Position
Metro Brands ranks among India's biggest dedicated shoe sellers when measured by number of outlets. Reaching over a thousand locations by March 2026.
3. Promoter / Founder Introduction
3.1 Founder: Malik Tejani
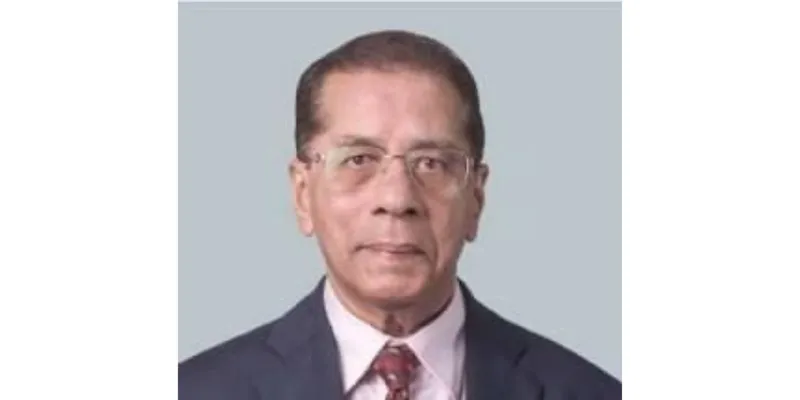
Metro Brands began when Malik Tejani started the company in 1955. Though few know his name today, his skill with words built early trust.
3.2 Current Promoter: Rafique Malik & Family
After Malik Tejani, his son Rafique Malik took over the family business at the age of 16. Today, Farah Malik Bhanji serves as Managing Director, while Nissan Joseph is the CEO.
3.3 Role in Company Growth
One idea guided the Malik family when shaping Metro Brands - prioritize steady profits instead of rapid expansion. Ownership stayed concentrated.
4. Financial Statement Analysis
4.1 Income Statement Analysis
This table shows how Metro Brands’ sales, costs, and profit changed over three years.
Metric (₹ Crore) | FY2023 | FY2024 | FY2025 |
|---|---|---|---|
Revenue (Sales) | 2,127 | 2,357 | 2,507 |
Total Expenses | 1,447 | 1,653 | 1,748 |
Operating Profit (EBITDA) | 680 | 704 | 759 |
Operating Profit Margin % | 32% | 30% | 30% |
Net Profit | 365 | 415 | 354 |
Net Profit Margin % | 17.2% | 17.6% | 14.1% |
EPS (₹ per share) | 13.30 | 15.17 | 12.88 |
Despite a rise in net profit during FY24, the following year saw a drop due to mounting costs tied to store expansions and upgrades.
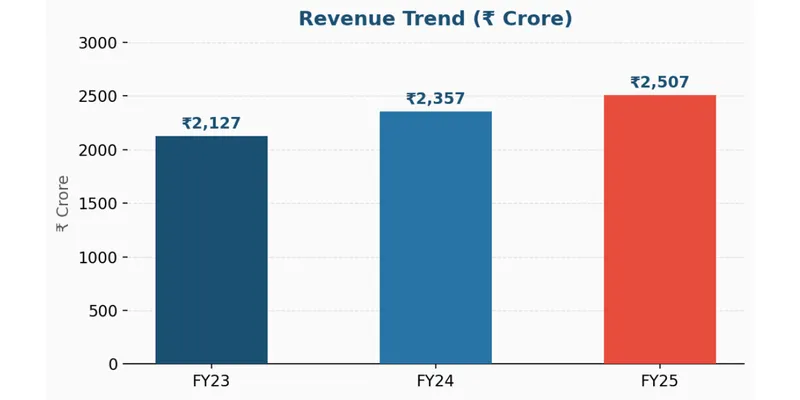
Figure 1: Revenue Trend FY23–FY25 (Source: Screener.in)
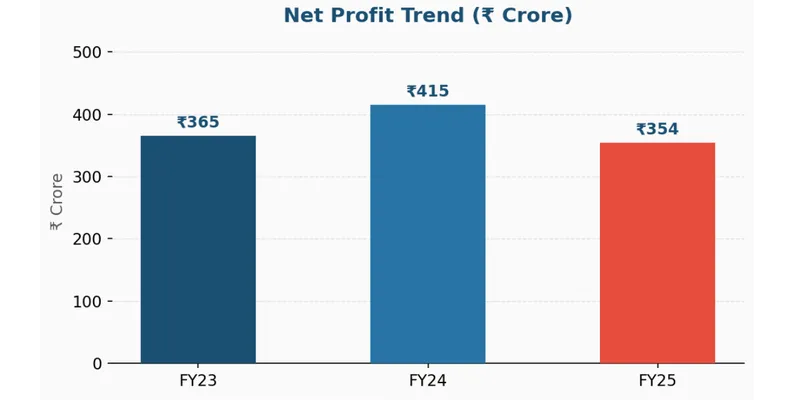
Figure 2: Net Profit Trend FY23–FY25 (Source: Screener.in)
4.2 Balance Sheet Analysis
This table shows how Metro Brands’ balance sheet evolved over three years.
Item (₹ Crore) | FY2023 | FY2024 | FY2025 |
|---|---|---|---|
Total Assets | 2,906 | 3,353 | 3,334 |
Fixed Assets | 1,302 | 1,482 | 1,602 |
Investments | 478 | 750 | 550 |
Equity Capital + Reserves | 1,548 | 1,864 | 1,709 |
Total Borrowings | 943 | 1,098 | 1,227 |
Other Liabilities | 416 | 391 | 398 |
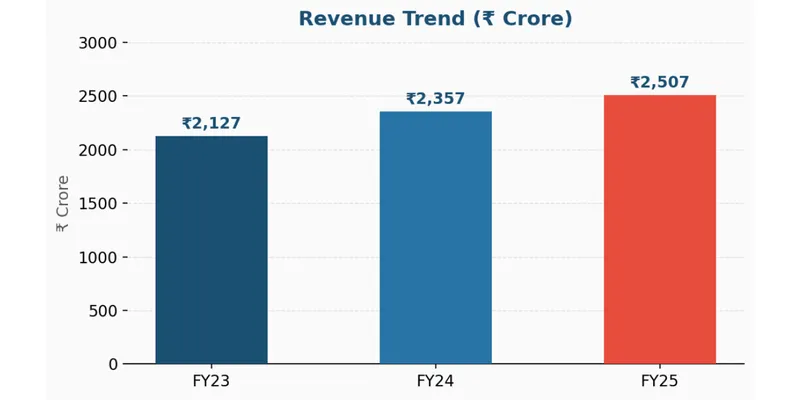
Figure 1: Revenue Trend FY23–FY25 (Source: Screener.in)
Despite remaining steady in FY25, total assets climbed to ₹3,353 crore in FY24 from ₹2,906 crore the prior year.
4.3 Cash Flow Analysis
This table shows Metro Brands’ cash flow pattern over three years.
Cash Flow (₹ Crore) | FY2023 | FY2024 | FY2025 |
|---|---|---|---|
From Operations (+) | 381 | 590 | 698 |
From Investing (−/+) | -52 | -251 | +122 |
From Financing (−) | -359 | -323 | -773 |
Net Cash Flow | -30 | +16 | +47 |
Strong growth marks operating cash flows, climbing from ₹381 crore in FY23 to ₹698 crore by FY25. Financing outflows during FY25 trace back largely to big dividend distributions.
4.4 Key Financial Ratios
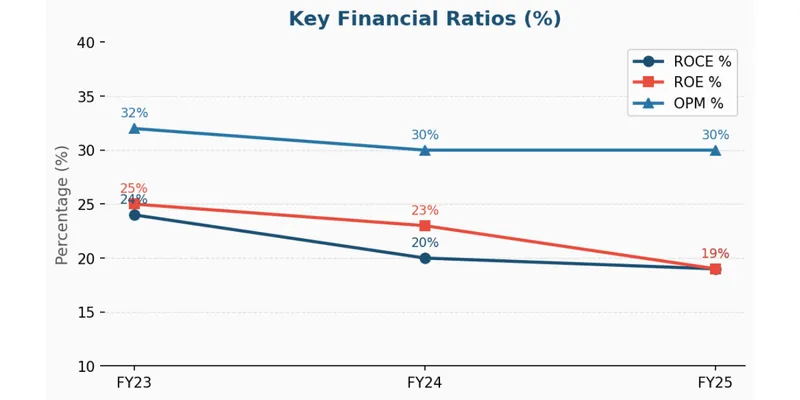
ROCE and ROE have declined slightly but are still healthy at 19%. The dividend payout jumped to 155% in FY25 because the company paid a special dividend.
Ratio | FY2023 | FY2024 | FY2025 | What It Means |
|---|---|---|---|---|
ROCE % | 24% | 20% | 19% | Return on capital used |
ROE % | ~25% | ~23% | 19% | Return on shareholders’ money |
OPM % | 32% | 30% | 30% | Operating profit margin |
Debtor Days | 18 | 12 | 13 | Days to collect payment (low = good) |
Inventory Days | 276 | 274 | 228 | Days goods sit in stock |
Dividend Payout % | 30% | 33% | 155% | % of profit paid as dividend |
5. Key Insights & Interpretation
5.1 Strengths
A decade of steady income expansion reveals a 13% compound annual rise
A solid 30% in operating margins stands out when compared to typical retail results.
Cash flow increase reflects consistent income generation through core business activities.
5.2 Weaknesses
Despite steady revenue, net profit fell during FY25. Margins narrowed because of cost increase.
With stock sitting around 228 to 276 days, funds remain tied up in inventory.
Even now, most sales happen in actual shops; online trade brings just 10.6 percent of income.
5.3 Risk Factors
When economies slow, people often delay buying shoes. Demand falls as wallets tighten.
Bata, Relaxo, Campus and Myntra are key competitors.
Rent increases directly affect bottom-line results for retail operators.
A single misstep in selecting styles might leave shelves full of unsold items.
5.4 Future Outlook
Metro Brands appears ready to meet what lies ahead. As online efforts strengthen, keeping costs in check becomes key.
6. Conclusion
6.1 Final Evaluation of Financial Health
Metro Brands is financially healthy overall. Revenue and operating cash flows growing, margins stable 30%, and has no serious debt stress. FY25 profit dip mainly due to expansion and special dividends.
6.2 Investment Perspective
Metro Brands stands out as a carefully managed retail business built on brand strength and reliable leadership. Its shares trade high, reflecting steep expectations. Progress in margins, online expansion, and store performance will shape future returns.
Sources:
Screener
BSE