MAYUR UNIQUOTERS LTD.’s FINANCIAL & BUSINESS ANALYSIS REPORT
1. Introduction (about Mayur Uniquoters Ltd.)
- Brief Introduction of the company
Home base in Jaipur, Mayur Uniquoters Limited makes synthetic leather using PU and PVC materials. Their work reaches factories of cars, shoes, home items, besides clothing trimmings.
- Industry overview
Fast growth in synthetic leather comes from cars, shoes, and home furnishings needing more of it. Because people care more about nature now, better tech helps make artificial leather cheaper. One reason India plays a big role is because making it there costs less money, along with more buyers inside the country wanting it.
- Purpose of the Analysis
Purpose of the analysis is to evaluate the financial performance, strengths / weaknesses/ risks/ future outlook etc. of Mayur Uniquoters Ltd.
2. Company Overview of Mayur Uniquoters Ltd. -
- Background and History-
Starting out in 1992, Mayur Uniquoters jumped into making synthetic. Growth came piece by piece - each phase adding more output, broader offerings. Partnerships took root slowly, linking arms with top car makers and shoe names alike.
- Business Model of Mayur Uniquoters Ltd.-
Production happens through coated materials made with modern methods. Instead of selling directly to consumers, goods go to manufacturers and industry buyers. Most income comes from long-term deals with car makers and shoe producers.
- Key Products / Services
- PVC Synthetic Leather
- PU Synthetic Leather
- Automative upholstery materials
- Footwear & furnishing materials
- Market Position
Firmly rooted in India, Mayur Uniquoters ranks among the biggest makers of synthetic leather. Not just limited to domestic reach, its work connects deeply with major car builders across the industry.
3. Promoter /Founder Introduction-
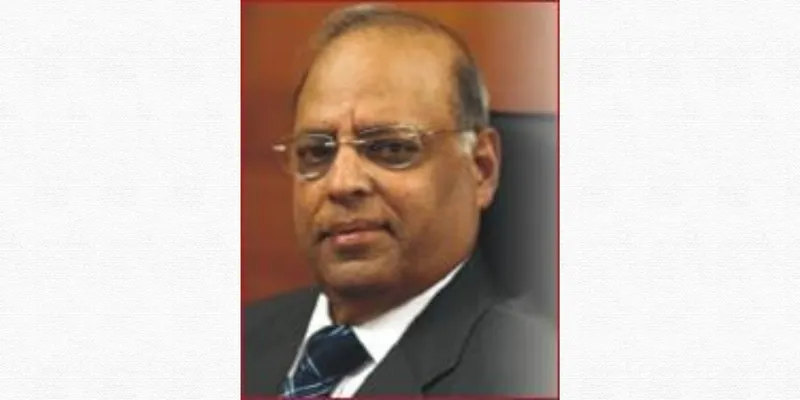
(Suresh Kumar Poddar, Founder)
Name | Professional Background | Strategic Role |
Suresh Kumar Poddar | Science Graduate; 50+ years in leather trading and manufacturing. | Visionary Founder: Built the company from a single line in 1994 to India's market leader. |
Manav Poddar | MBA; joined the family business in 2000. | Operational Strategy: Modernised manufacturing and scaled production efficiency. |
4. Financial Statement Analysis=
- Income Statement evaluation -
Particulars | Revenue (in Crore) | Net Profit (in Crore) |
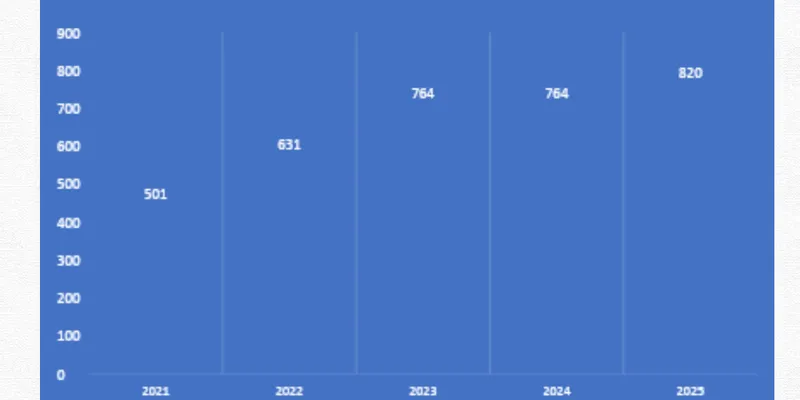
FY 2023 | 764 | 107 |
FY 2024 | 764 | 120 |
FY 2025 | 820 | 141 |
Key Observations-
Growth picked up noticeably during FY2025. From ₹764 crore the year before, revenue reached ₹820 crore - up roughly 7.32%. Net profit climbed to ₹141 crore from ₹120 crore, a rise near 17.5 %, thanks largely to tighter spending and smoother operations.
Revenue Trend-
- Balance Sheet Analysis of the company-
Every now and then, Mayur Uniquoters keeps its finances tight by holding little debt. Built up slowly over time, funds come mostly from what the business earns itself. A solid pile of owner money sits beneath it all. Not much is owed, thanks to careful borrowing habits that stay cautious almost all the way through.
- Cash Flow Analysis (of FY 2025)
Strong cash generation marked the year’s operational performance. Around ₹156.9 crore flowed in from core business, thanks to better profits and tighter control over day-to-day funds. Spending on new assets took money out of the system, driven by upgrades and growth plans. Debt payments shaped the financial moves, pulling cash down while keeping leverage low.
- Key Financial Ratios (FY 2025)
Profitability Ratio - Net Profit Margin
There was an increase in net profit margin to around 17% in FY 2025.
Liquidity Ratio – Current Ratio
The current ratio is above 1.5, which suggests that company has sufficient short term assets to meet its current liabilities.
Leverage Ratio – Debt to Equity Ratio
Debt to Equity Ratio of the company is low, which reflects that company is financially stable.
Efficiency Ratio – Inventory Turnover ratio
The inventory management of the company is good due to high demand and large distribution channels.
- Year-O-Year Comparison
Year | Revenue | Net Profit | Net Profit Margin |
FY2023 | 764 | 107 | 14.00% |
FY2024 | 764 | 120 | 15.71% |
FY2025 | 820 | 141 | 17.19 % |
5. Key Insights & Interpretation=
Strengths of Mayur Uniquoters Ltd-
Starting off strong, Mayur Uniquoters holds firm ground in making synthetic leather. Instead of relying on just one type of buyer, it works with many different customers. Profit numbers stay solid, thanks to steady financial control.
Weaknesses of Mayur Uniquoters Ltd-
Even with solid basics, reliance sits mostly on cars and shoes. When those areas slow down, orders for synthetic leather tend to drop right after. Price shifts in supplies also play a big role in how much money gets kept.
Risk Factors of Mayur Uniquoters Ltd-
Facing shifts in global markets might push material prices higher. One thing after another - demand swings, pressure from overseas makers of synthetic leather - adds strain.
Future Outlook of Mayur Uniquoters Ltd-
Bright days lie ahead for Mayur Uniquoters as car makers, home goods brands, while clothing designers seek more synthetic leather. Overseas buyers are showing greater interest just as eco-friendly material choices gain traction worldwide. Upgrades in production methods alongside fresh designs might quietly boost how it stands among rivals.
6. Conclusion =
- Final Evaluation of Financial Health
Bold numbers mark the year again. A steady climb in earnings shows up clearly across quarters. Profits edge higher, not by luck but through careful handling of costs. The books stay clean, no heavy borrowing weighing things down. Cash keeps flowing in, enough to cover moves without leaning on loans.
- Investment or Performance Perspective
From an investment perspective, the company appears to be a financially stable mid-cap manufacturing firm with steady growth potential.
Data Sources
https://www.mayuruniquoters.com/
https://www.screener.in/company/MAYURUNIQ/