Low & Bonar
Executive Summary
Low & Bonar operated in technical textiles and high-performance materials. The material is utilized for construction, transportation, agriculture, and environmental reasons. Low & Bonar Company was founded in 1912; however, in 2020, Freudenberg Group took over Low & Bonar Company.
Before being acquired by Freudenberg, Low & Bonar reported earnings of £317.3 million in 2019. The post-acquisition financial analysis of the firm will be done with reference to the financial information of the Freudenberg Group. Generally, the firm displays industry competence and good growth potential in technical textiles.
Company Overview
Low & Bonar was established in Dundee, Scotland, in 1912 by John Low and George Bonar and later expanded its operations internationally. Initially, it dealt with jute weaving but later ventured into the technical textiles field. The company's products have a wide range of applications, including in construction, transport, agriculture, the environment, and industries.
Acquisition and Status
- Freudenberg Group bought all shares of Low & Bonar.
- The company was removed from the London Stock Exchange in May 2020.
- It now operates under the Freudenberg Group as part of its Performance Materials division.
Industry Overview
Low & Bonar works in the technical textiles industry. Technical textiles are fabrics used for industrial and practical purposes rather than clothing.
These materials are widely used in construction, roads, railways, agriculture, filtration, transportation, and environmental projects.
Low & Bonar's key products include;
Geosynthetics, industrial fabrics, coated fabrics, nonwoven materials, fibres, and composite materials
The following table shows Low & Bonar's revenue as an independent company.
Year | Revenue (£ Million) |
2018 | 361.6 |
2019 | 317.3 |
Low & Bonar became part of the Freudenberg Group in 2020; the analysis is based on the financial data of the Freudenberg Group.
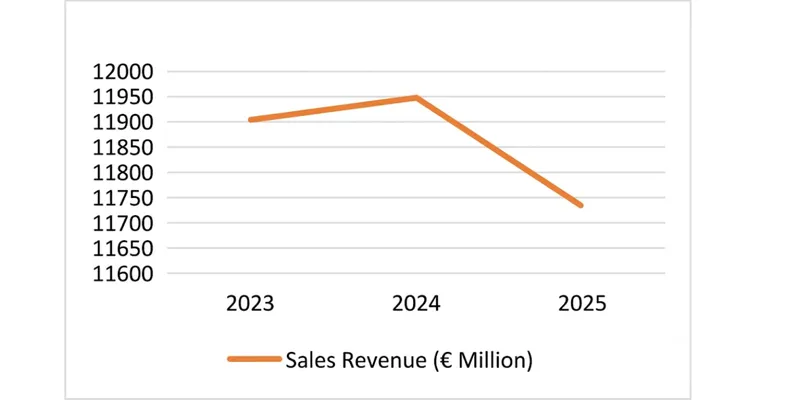
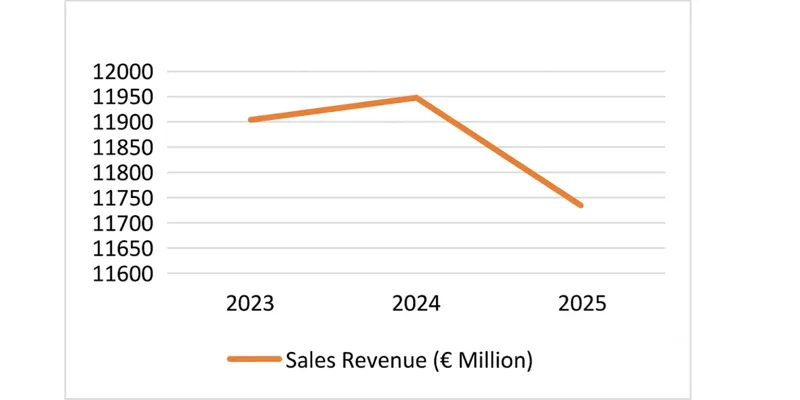
Year | Sales Revenue (€ Million) |
2023 | 11903 |
2024 | 11947 |
2025 | 11732 |
Financial Performance Analysis
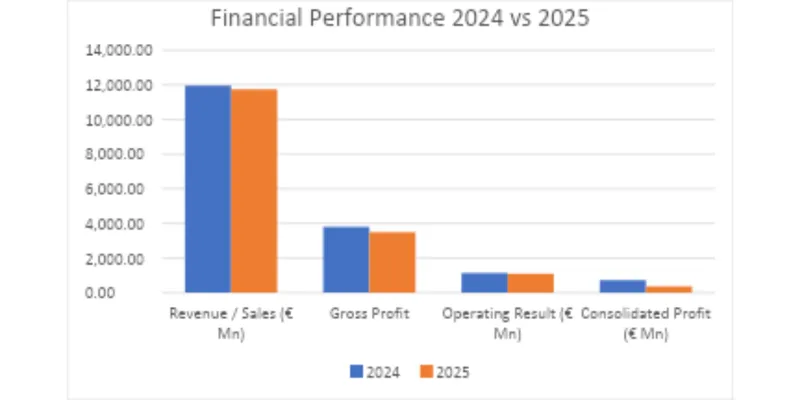
The following table shows the financial performance of the previous and current years.
Particulars | 2024 | 2025 |
Revenue / Sales (€ Mn) | 11,947.5 | 11,731.9 |
Gross Profit | 3,812.9 | 3,491.3 |
Operating Result (€ Mn) | 1,132.40 | 1,092.70 |
Consolidated Profit (€ Mn) | 724.8 | 361.9 |
Key Financial YOY
Revenue Trend Over 3–5 Years
Interpretation
- Revenue slightly decreased in 2025.
- Gross profit also decreased, which shows less profitability from core operations.
- Operating result remained stable despite market challenges.
- Consolidated profit decreased slightly because of higher expenses and business-related challenges.
Key Financial Ratio
Ratio | Formula | Value | Interpretation |
Current Ratio | Current Assets / Current Liabilities | 1.48 | Good short-term liquidity |
Quick Ratio | Current Assets − Inventory / Current Liabilities | 1.04 | Acceptable immediate liquidity |
Gross Margin | Gross Profit / Sales | 29.76% | Healthy gross profitability |
Net Margin | Net Profit / Sales | 3.08% | Net profit declined in 2025 |
ROE | Net Profit / Equity | 4.56% | Lower return due to profit fall |
Debt-to-Equity | Debt / Equity | 0.28 | Moderate leverage |
Interest Coverage | Profit from Operations (EBIT) / Interest Expense | 1.77 times | Lower ability to cover interest |
Inventory Turnover | Cost of Sales / Inventory | 4.59 times | Inventory converted into sales about 4.6 times |
Asset Turnover | Sales / Total Assets | 0.84 times | Assets used reasonably efficiently |
SWOT Analysis
Strengths | Weaknesses |
Strong reputation in technical textiles and performance materials | Revenue declined before acquisition |
Global presence with operations across multiple countries | Dependencies on construction and industrial markets |
Wide range of products from geotextiles, coated fabrics and nonwovens | Limited standalone financial information after acquisition |
Long experience and established customer relationships | Exposure to economic cycles in key end markets |
Opportunities | Threats |
Growing demand for technical textiles and sustainable materials | Intense competition from companies such as Freudenberg, Ahlstrom, and Toray |
Expansion in infrastructure and environmental projects | Fluctuations in raw material and energy costs |
Increasing use of geosynthetics in construction and transportation | Economic slowdowns affecting industrial demand |
Development of innovative and eco-friendly textile solutions | Changes in environmental and trade regulations |
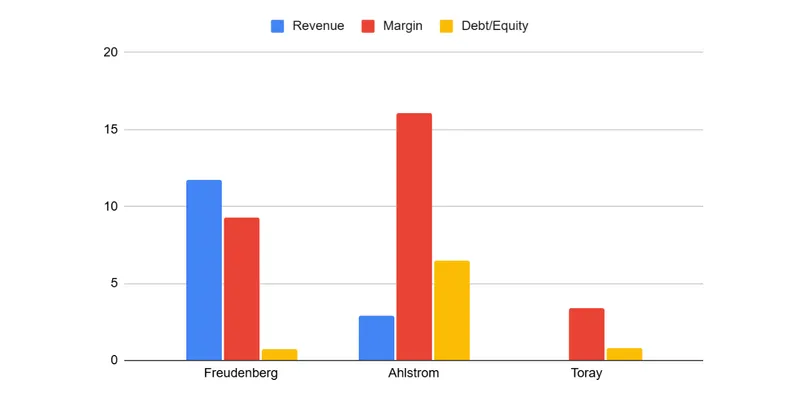
Peer / Competitor Comparison
Company | Revenue | Margin | Debt/Equity |
Freudenberg | 11.73 | 9.3 | 0.75 |
Ahlstrom | 2.93 | 16.1 | 6.46 |
Toray | 17.20* | 3.4 | 0.81 |
Conclusion and Recommendations
Low & Bonar was working in the technical textiles industry. The company made a revenue of £317.3 million in 2019. Later in 2020, Low & Bonar was merged with the Freudenberg Group
Hence, the analysis is based on Freudenberg Group data. It shows stable operations and a strong financial position despite a decline in profit during 2025.
References & Sources
- Freudenberg Group Official Website
- Freudenberg Group Annual Report 2025
- Low & Bonar LinkedIn
- Low & Bonar Annual Report 2019
- Excel (used for tables, charts, and financial analysis)