Lenskart Solutions Limited

1. Introduction
Started back in 2008, Lenskart Solutions Limited operates in India’s eyewear space. Headlines followed when the firm went public on November 10, 2025. The largest consumer sector listings seen that year. Now traded on BSE and NSE (LENSKART), its main office sits in Okhla, Delhi.
By fiscal year 2025, Lenskart had become India's biggest seller of prescription glasses by number sold. From start to finish, its business handles everything itself production, branding, and sales - offering frames, sunshades, contacts, along with related items across Indian cities and countries such as Singapore, the Emirates, Japan, and parts of Thailand. Stores totaled 2,723 on March 31, 2025: over two thousand within India, the rest spread overseas.
This report pulls consolidated FY23–FY25 data strictly from Screener.in and BSE filings.
2. Company Overview
Background and History
Started back in 2010, from just an internet-based seller, it slowly spread physical locations nationwide. Production units rose in Bhiwadi, Rajasthan, followed by another in Gurugram, Haryana. This blend made them different from traditional glasses stores found on street corners.
Business Model and Products
A group of 109 designers builds custom frames and lenses, made centrally to enable fast shipping across four dozen urban centers in India. Their offerings include eyeglasses - sold through nearly two thousand company-run and partner shops nationwide as well as sun shades bearing in-house names or external licenses, along with contact lenses and related items.
IPO and Post-Listing
That IPO raised 7,278 crore total, part new money at 2,151 crore, part sale via OFS at 5,128 crore. Money collected goes toward opening shops, rental agreements, digital upgrades, promotion efforts.
3. Promoter Introduction
Promoter holding is 17.57% as of December 2025. Screener flags a 6.26% decline in promoter holding over the last quarter. Key promoters and management:
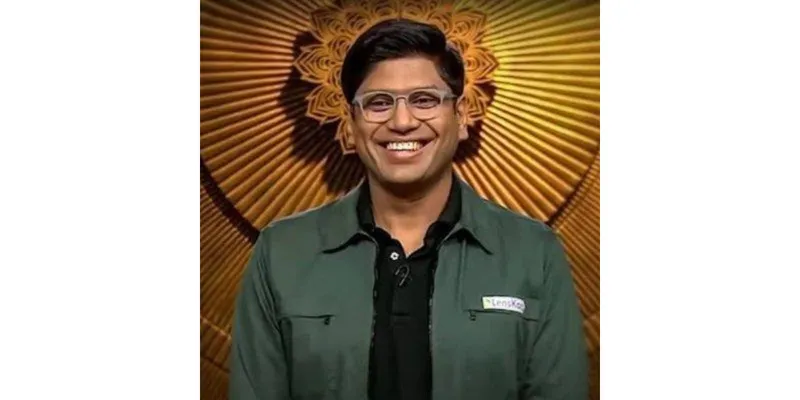
Peyush Bansal – Co-founder, MD, CEO
Neha Bansal

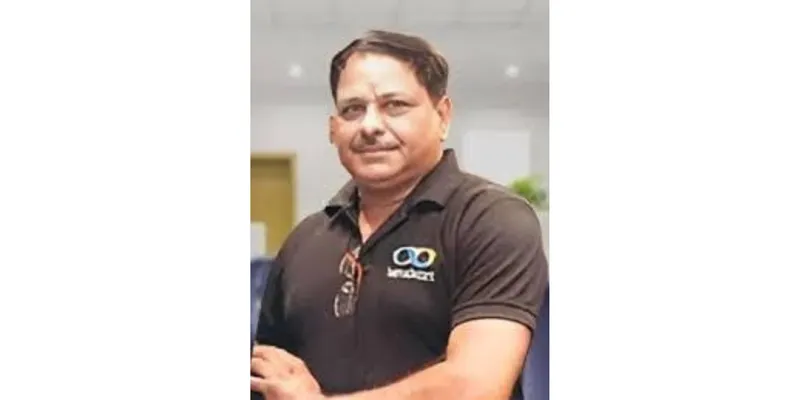
Amit Chaudhary

Sumeet Kapahi
Name | Role | Background |
|---|---|---|
Peyush Bansal | Co-Founder, MD, CEO | IIT Delhi grad, ex-Microsoft, Shark Tank India judge; drives strategy |
Neha Bansal | Promoter | Promoter group member |
Amit Chaudhary | Co-Founder & COO | manages daily operations |
Sumeet Kapahi | Co-Founder & CPO | leads product development |
Promoter holding of 17.57% is on the lower end for a recently-listed company. DIIs hold 15.86% and FIIs hold 3.86% the institutional base is meaningful
4. Financial Statement Analysis
Data Source Note
Figures from Screener.in consolidated statements cover Indian and overseas operations for FY23–FY25.
4.1 Income Statement (FY23–FY25)
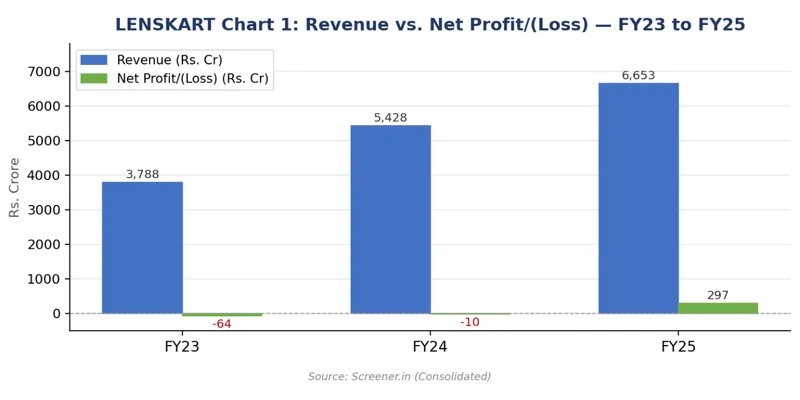
Revenue surged from Rs. 3,788 crore to Rs. 5,428 crore, then Rs. 6,653 crore. Operating profit rose Rs. 264 crore to Rs. 680 crore to Rs. 977 crore. Net profit turned positive at Rs. 297 crore in FY25. No dividends paid.
Particulars (Rs. Crore) | FY23 | FY24 | FY25 |
|---|---|---|---|
Revenue (Sales) | 3,788 | 5,428 | 6,653 |
Total Expenses | 3,524 | 4,748 | 5,675 |
Operating Profit | 264 | 680 | 977 |
OPM % | 7% | 13% | 15% |
Interest | 83 | 124 | 147 |
Depreciation (incl. RoU) | 418 | 672 | 797 |
Net Profit/(Loss) | -64 | -10 | 297 |
EPS (Rs.) | -8.34 | -2.26 | 3.83 |
Income Statement FY23–FY25 (Source: Screener.in Consolidated)
4.2 Balance Sheet (FY23–FY25)
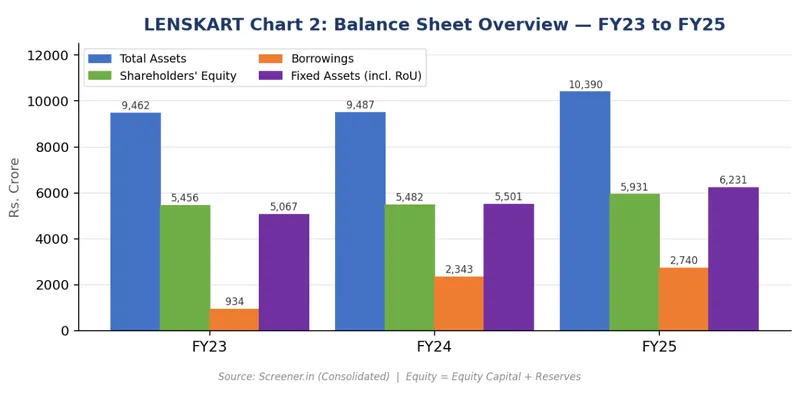
Total assets grew driven by RoU assets. Equity climbed to Rs. 5,931 crore; borrowings jumped (lease + growth debt). Book value stable ~Rs. 36.6/share.
Particulars (Rs. Crore) | FY23 | FY24 | FY25 |
|---|---|---|---|
Equity Capital | 15 | 15 | 154 |
Reserves | 5,441 | 5,467 | 5,777 |
Borrowings (incl. Leases) | 934 | 2,343 | 2,740 |
Other Liabilities | 3,071 | 1,661 | 1,718 |
Total Assets | 9,462 | 9,487 | 10,390 |
Fixed Assets (incl. RoU) | 5,067 | 5,501 | 6,231 |
Book Value/Share (Rs.) | ~36.9 | ~37.1 | ~36.6 |
Balance Sheet Summary FY23–FY25 (Source: Screener.in)
4.3 Cash Flow
Operating cash accelerated, reflecting true business cash generation. Investing focused on store expansion; financing repaid debt/leases. Net cash up Rs. 434 crore in FY25.
Cash Flow (Rs. Crore) | FY23 | FY24 | FY25 |
|---|---|---|---|
Operating | 95 | 487 | 1,231 |
Investing | -2,586 | 163 | -262 |
Financing | 2,777 | -722 | -535 |
Net Change | 285 | -72 | 434 |
Table 4: Cash Flow Summary FY23–FY25 (Source: Screener.in Consolidated)
4.4 Key Ratios
Ratio | FY23 | FY24 | FY25 | Observation |
|---|---|---|---|---|
ROCE % | -0% | 2% | 6% | Steady rise |
OPM % | 7% | 13% | 15% | Strong expansion |
Debtor Days | 27 | 23 | 7 | D2C efficiency |
Inventory Days | 163 | 148 | 198 | High eyewear variety |
Working Capital Days | 57 | 11 | -5 | Negative = efficient |
EPS (Rs.) | -8.34 | -2.26 | 3.83 | Profitable turnaround |
Promoter Holding | N/A | N/A | 17.57% | Declining post-IPO |
P/E at IPO | N/A | N/A | ~105x | Premium valuation |
Key Financial Ratios FY23–FY25 (Source: Screener.in)
5. Key Insights and Interpretation
Revenue Growth and Profitability Turn
Revenue grew at a 3-year CAGR of 64% from FY23 to FY25. OPM expanded from 7% to 15%, an indicator that the business model is generating real cash. Net profit of Rs. 297 crore in FY25 marks the first year of bottom-line profitability. However, it is important to note that a significant portion of FY25 profitability includes Rs. 351 crore in 'other income' Screener flags this explicitly. Stripping out other income, core operating profitability is thinner.
Depreciation and Ind AS 116
Depreciation of Rs. 797 crore in FY25 is extremely high relative to operating profit of Rs. 977 crore. Most of this reflects right-of-use assets under Ind AS 116.
Valuation — Premium Pricing
ROCE is still only 6% despite strong revenue growth. These are legitimate valuation concerns for a growth company.
Future Outlook
Lenskart's long-term thesis is India's massive underserved eyewear market. Screener notes the unorganised sector still holds 77% of prescription eyewear sales by value. Ahead of the pack with 2,723 locations and 100 million app users, it builds its own products while selling directly to customers. While glasses powered by AI hit the market, deeper tech bets suggest a climb toward higher ground.
6. Conclusion
Lenskart Solutions Limited is India's largest organised prescription eyewear company — a genuine growth business with Rs. 6,653 crore in revenue, expanding margins, strong operating cash flows, and a clear market leadership position.
The key concerns are the premium valuation (P/E ~100x, P/B ~13x), declining promoter holding, and the significant contribution of non-core 'other income' to FY25 profits. At Rs. 489 per share and market cap of Rs. 84,850 crore, the stock is pricing in substantial future growth that needs to continue materialising.
Sources:
- Screener
- BSE