Kuraray Co Ltd

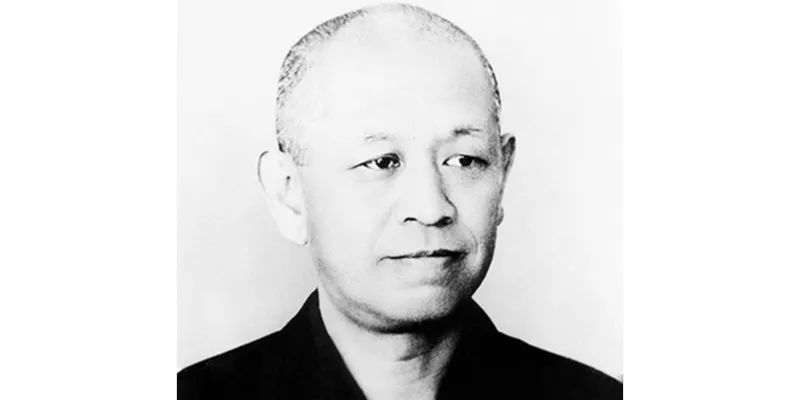
Founder Name : Magosaburo Ohara
Executive Summery
Introduction Kuraray Co., Ltd is a Japanese company that is known all around the world owing to its cutting-edge technology in manufacturing high-tech materials, specialty chemicals, fibers, and textile products. This company was founded in 1926 and gained recognition due to its innovation and sustainability along with quality manufacturing. The products and services of Kuraray are used in various industries such as automobiles, pharmaceuticals, packaging, and garments. Some popular products of Kuraray include Clarino synthetic leather and KURALON fiber.
Company Overview
Kuraray Co., Ltd. has its headquarters located in Tokyo, Japan, and is said to be one of the top companies that manufacture specialty chemicals and synthetic fibers. Originally, the company started as a rayon producer but gradually became an innovator that creates special solutions for application in different industries such as the textile industry, industry, medicine, and consumer goods. Due to the international nature of its operations and vast research, the company plans to become an innovator in sustainability and technology innovations.
Industry Overview
The Specialty Fibers industry involves the manufacturing of specialty fibers, which can be used in specific applications by various industries. Unlike the general fiber that can be applied in the production of common textile products, the specialty fibers have several benefits including being durable, heat resistant, weight strength, moisture management and sustainable. There are numerous uses of specialty fibers in varied industries such as sports, automobiles, medicine, aerospace, and protection clothing. Due to the heightened concern of environmental protection, firms have stepped up their investments in research and development, recycling and smart textiles. Despite several constraints including higher costs and demand fluctuations globally, the industry is performing well due to technology innovation.
Financial Performance
Particulars | 2024 (Millions of Yen) | 2025(Millions of Yen) |
|---|---|---|
Net Sales | 808,447 | 826,895 |
Cost of Sales | 561,939 | 559,374 |
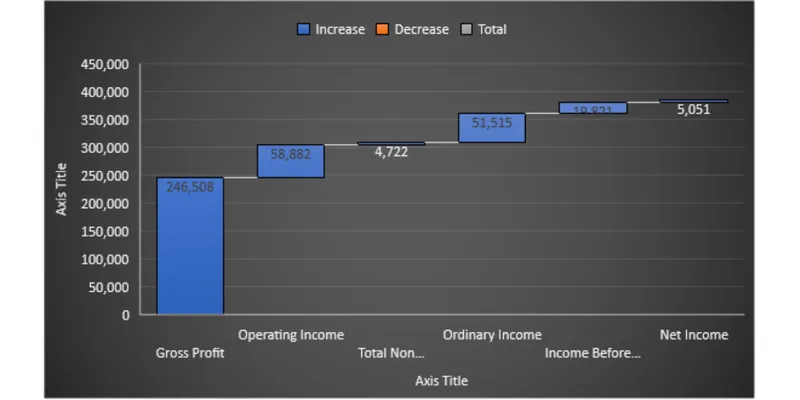
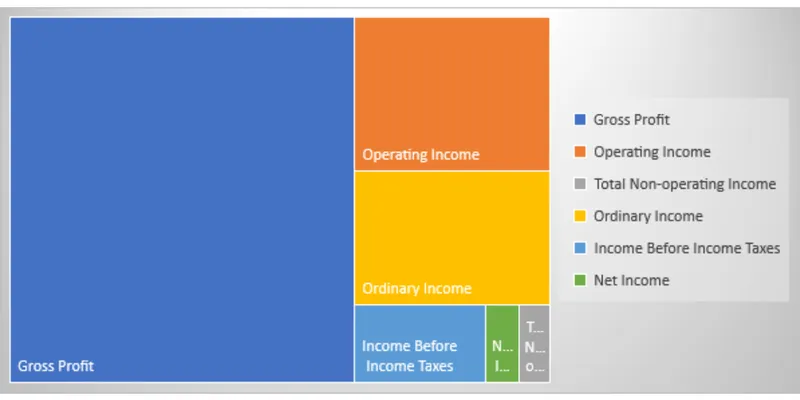
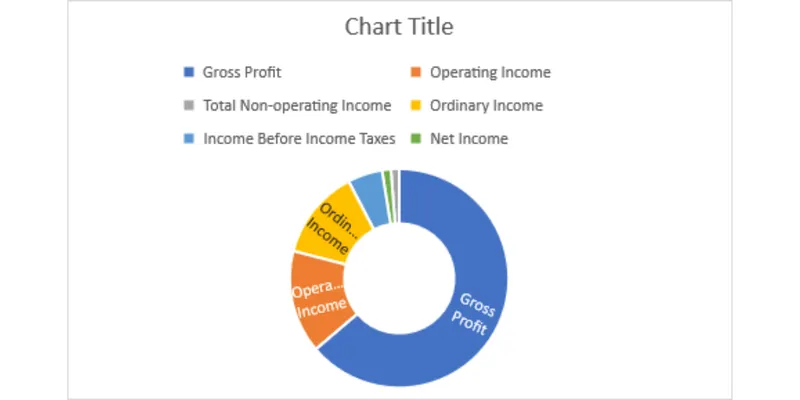
Gross Profit | 246,508 | 267,520 |
Selling, General & Administrative Expenses | ||
Selling Expenses | 47,758 | 47,038 |
General & Administrative Expenses | 139,867 | 135,401 |
Total Selling, General & Administrative Expenses | 187,625 | 182,439 |
Operating Income | 58,882 | 85,081 |
Non-operating Income | ||
Interest Income | 2,256 | 3,418 |
Dividend Income | 830 | 731 |
Share of Profit of Equity Method Entities | 338 | 331 |
Other Income | 1,297 | 1,752 |
Total Non-operating Income | 4,722 | 6,234 |
Non-operating Expenses | ||
Interest Expenses | 2,807 | 2,738 |
Foreign Exchange Losses | 1,246 | 1,202 |
Loss on Disposal of Tangible Non-current Assets | 1,475 | 1,433 |
Other Expenses | 6,561 | 4,459 |
Total Non-operating Expenses | 12,090 | 9,835 |
Ordinary Income | 51,515 | 81,480 |
Extraordinary Income | ||
Gain on Sale of Investment Securities | 5,086 | 1,526 |
Insurance Claim Income | 705 | – |
Subsidy Income | 557 | – |
Total Extraordinary Income | 6,349 | 1,526 |
Extraordinary Losses | ||
Impairment Loss | 29,626 | 16,793 |
Costs Related to Suspension of Operations | 4,604 | 1,346 |
Loss on Disposal of Tangible Non-current Assets | 1,468 | 5,341 |
Loss on Sale of Tangible Non-current Assets | 1,021 | – |
Loss on Liquidation of Business | 848 | 4,452 |
Loss on Tax Purpose Reduction Entry of Non-current Assets | 474 | – |
Loss on Contingent Liabilities | – | 1,896 |
Total Extraordinary Losses | 38,044 | 29,830 |
Income Before Income Taxes | 19,821 | 53,176 |
Income Taxes – Current | 15,082 | 23,932 |
Income Taxes – Deferred | (312) | (1,932) |
Total Income Taxes | 14,769 | 22,000 |
Net Income | 5,051 | 31,176 |
Net Loss Attributable to Non-controlling Interests | (2,417) | (548) |
Net Income Attributable to Owners of Parent | 7,468 | 31,724 |
Graph
Chart
Key Financial Ratio
Financial Ratio | 2025 | 2024 |
Gross Profit Margin | 32.35% | 30.49% |
Operating Profit Margin | 10.29% | 7.28% |
Net Profit Margin | 3.77% | 0.63% |
SG&A Expense Ratio | 22.06% | 23.21% |
Cost of Sales Ratio | 67.65% | 69.51% |
Ordinary Income Margin | 9.85% | 6.37% |
Effective Tax Rate | 41.37% | 74.51% |
Interest Expense Ratio | 0.33% | 0.35% |
Net Income Growth Rate | 517.23% | — |
Operating Income Growth Rate | 44.49% | — |
SWOT Analysis
Strengths:
- Good brand image and expertise in technology worldwide
- A variety of businesses in different sectors such as chemicals, fibers, and advanced materials
Weaknesses:
- Dependence on global economic conditions and demand
- Vulnerability to fluctuations in prices of raw materials and foreign exchange risk
Opportunities:
- Growing demand for environmentally friendly and performance-oriented textile materials
- Entering emerging countries and applications in healthcare
Threats:
- Global competition and environment protection laws
- Economic recession limiting industrial and consumer demand
Conclusion
It can be stated that Kuraray Co., Ltd. is able to position itself as a global organization due to innovations, quality, and proper business conduct. As such, it should be mentioned that the success of this firm lies in its capability to adjust itself to new market conditions, as well as to develop superior material. Thus, with the help of innovations, consideration of the environment, and consumer preferences, it continues being an important player in its target markets. It seems that this firm is prepared to meet any difficulties and challenges in the future.
References
- Kuraray Co., Ltd Official Website
- Kuraray Co., Ltd Annual Report