Jindal Worldwide
Executive Summary
In 2026, the company reported a revenue of Rs 2,295.01 crore. It has a strong presence in the Indian denim market with a 9% market share. They have achieved lower profitability in 2026 because of higher operating and other expenses. The company is maintaining a good liquidity ratio. It is expanding its business in the EV sector. It is important to control and maintain their profitability to stay competitive in the market with industry leaders such as Arvind Limited and Vardhman Textiles.
Company Overview

Jindal Worldwide Limited is one of the largest fully integrated producers of denim fabric in Asia. The group was founded by Dr. Yamunadutt Agrawal in 1986. It has its headquarters located at Ahmedabad, Gujarat. The organization works through the entire textiles supply chain, and has ventured into sectors such as electric cars and finance.
Industry Overview
Jindal Worldwide Limited is one of the largest producers of denim fabric in Asia. It is responsible for about 9% of the market share in India’s denim market. It deals in high-end shirtings, bottom weights, yarn dyed and home textiles. Apart from marketing in India, it also exports worldwide to Europe and Latin America. It is also growing its business by investing in the electric vehicle (EV) industry. Jindal Worldwide operates across the entire textile value chain. It is expanding its business in the EV sector.
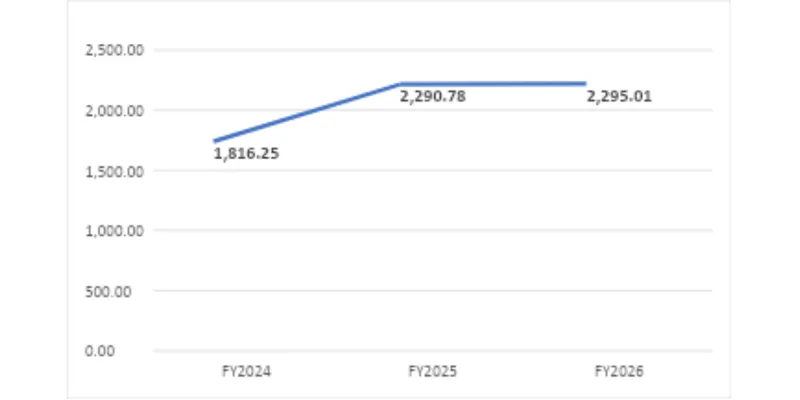
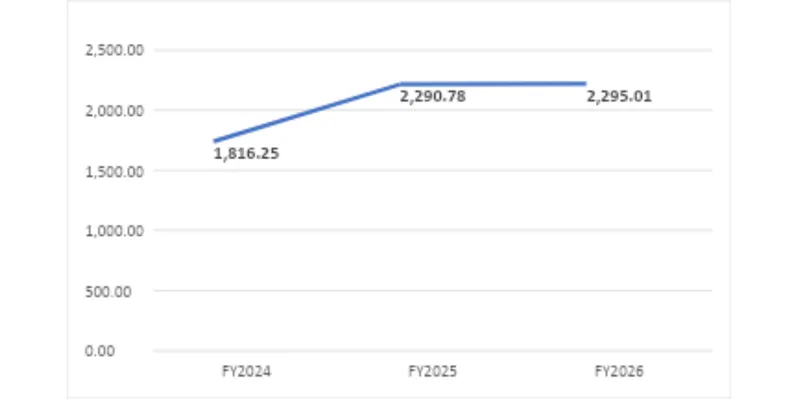
Year | Revenue (₹ Cr) |
FY2024 | 1,816.25 |
FY2025 | 2,290.78 |
FY2026 | 2,295.01 |
Financial Performance Analysis
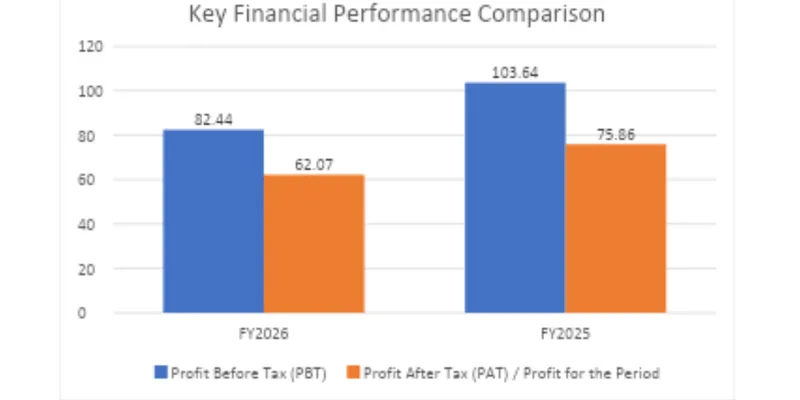
Particulars (₹ Cr) | FY2026 | FY2025 |
Revenue | 2,295.01 | 2,290.78 |
Profit Before Tax (PBT) | 82.44 | 103.64 |
Profit After Tax (PAT) | 62.07 | 75.86 |
Key Financial YOY
Revenue Trend Over 3–5 Years
Interpretation
The revenues have risen in 2026, showing steady operations of the company. Nevertheless, the PBT and PAT have reduced as compared to 2025 due to increased operating and other expenses.
Key Financial Ratios
Ratio Category | Formula | FY 2026 | Interpretation |
Current Ratio | Current Assets / Current Liabilities | 1.91 | Indicates the company has sufficient current assets to meet its short-term obligations. |
Quick Ratio | (Current Assets − Inventory) / Current Liabilities | 1.51 | Shows a strong ability to pay short-term liabilities without relying on inventory sales. |
Net Profit Margin % | Net Profit / Revenue × 100 | 2.71% | Profitability declined, indicating lower earnings from each rupee of sales. |
Return on Equity (ROE) | Net Profit / Shareholders’ Equity × 100 | 8.11% | Reflects a moderate return generated for shareholders. |
Debt-to-Equity Ratio | Total Debt / Shareholders’ Equity | 0.65 | Lower debt levels indicate a relatively healthy capital structure. |
Interest Coverage Ratio | EBIT / Interest Expense | 3.26 | The company can comfortably meet its interest obligations. |
Inventory Turnover | Cost of Sales / Inventory | 7.3 | Inventory is being converted into sales efficiently. |
Asset Turnover | Revenue / Total Assets | 1.32 | Assets are being utilized effectively to generate revenue. |
SWOT Analysis
Strengths | Weaknesses |
Vertically integrated operations, from yarn manufacturing to finished garments. | Business performance is sensitive to fluctuations in raw material prices. |
Strong distribution network and export presence in domestic and international markets. | Relatively low net profit margin compared to revenue. |
Diversification into the electric vehicle (EV) sector provides future growth potential. | Dependence on the textile industry for a major portion of revenue. |
Opportunities | Threats |
Growing demand for textiles and apparel in domestic and global markets. | Intense competition from domestic and international textile manufacturers. |
Expansion in the EV business can create new revenue streams. | Volatility in cotton, yarn, and other raw material prices. |
Increasing focus on sustainable and eco-friendly textiles. | Changes in government policies, trade regulations, and export duties. |
Peer / Competitor Comparison
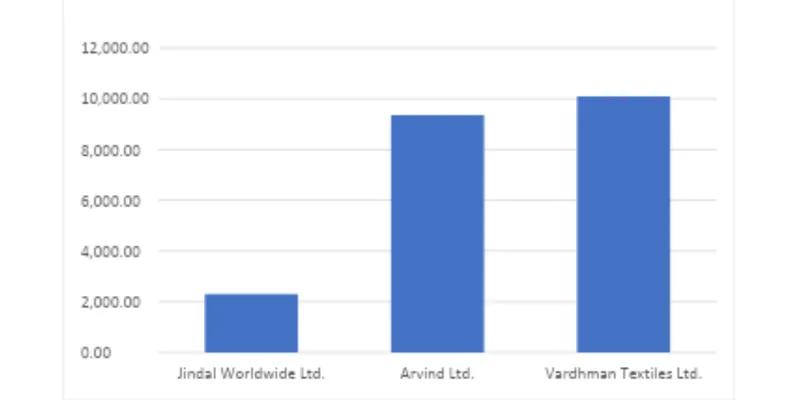
Company | Revenue (₹ Cr) | Net Profit Margin (%) | Debt/Equity (x) |
Jindal Worldwide Ltd. | 2,295.01 | 2.71% | 0.65 |
Arvind Ltd. | 9,359.51 | 4.51% | 0.36 |
Vardhman Textiles Ltd. | 10,092.53 | 7.66% | 0.18 |
Conclusion and Recommendations
Jindal Worldwide had revenue growth in 2026. This shows that the textile business of Jindal Worldwide is well known in the market. However, the profit decreased in 2026. The company is maintaining a good liquidity position. The company has to focus more on improving its profit. It will help in the EV business and can help strengthen its competitive position and support long-term growth.
References & Sources
- Jindal Worldwide Limited – Official Website
- Jindal Worldwide Limited – Annual Report FY2025-26
- Arvind Limited – Official Website and Annual Reports
- Vardhman Textiles Limited – Official Website and Annual Reports
- Moneycontrol – Financial Statements, Financial Ratios, and Peer Comparison Data.
- Microsoft Excel – Used for ratio analysis, data visualization, charts, and graph