India’s FDI Strength Holds Firm Amid Global Capital Shifts
A new CareEdge report reveals resilient fundamentals despite volatile net inflows.
India continues to draw robust foreign investment even as outward FDI, higher profit repatriation, and geopolitical shifts reshape global capital flows.
India continues to attract global investor interest despite a complex backdrop of rising profit repatriation, shifting global capital flows, and a broader slowdown in worldwide foreign direct investment (FDI). A new analysis by CareEdge provides a detailed, data-rich assessment of how India is positioned in an investment environment marked by geopolitical tension, supply-chain redesign, and changing capital allocation strategies.
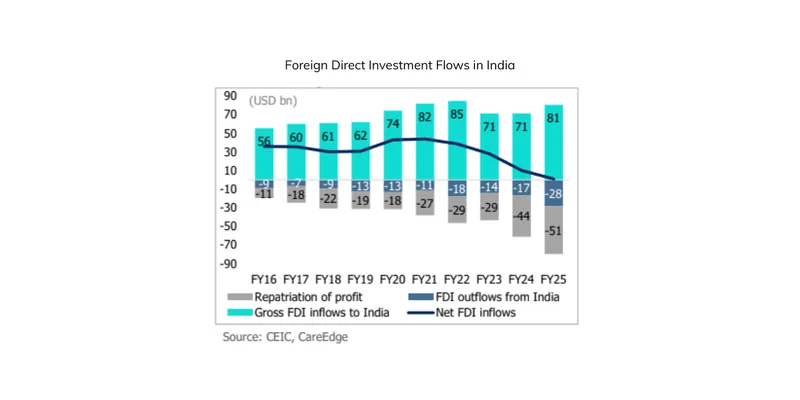
For the past five years, India’s gross FDI inflows have held steady in the USD 70–85 billion range, delivering a modest 2% CAGR (FY20–FY25). But the trend has recently strengthened: FY25 and the first half of FY26 saw a noticeable upturn in gross inflows. At the same time, outbound FDI and corporate profit repatriation by foreign investors have also accelerated, sharply reducing net inflows and signaling a phase of strategic reshaping within multinational portfolios.
According to the report, net FDI inflows collapsed from USD 44 billion in FY20 to just USD 1 billion in FY25, despite healthier gross inflows. The drag came from more active outward investment by Indian companies and higher remittance of profits by foreign firms—two trends that are not negative by themselves, but material enough to compress net numbers.
Profit repatriation, the report notes, is often a reflection of corporate maturity cycles, global capital strategies, and internal reinvestment choices. Outward investment, meanwhile, plays an increasingly important role in bringing “reverse technology spillovers” back to India, enhancing capabilities and competitiveness.
Global FDI: Slower, Smaller, and Structurally Different
To place India’s performance in context, CareEdge turns to global data—and the picture is notably subdued.
The ratio of global FDI to world GDP fell to 1.3% in 2024, a steep decline from 2.4% in 2021 and far below its 2007 peak of 5.3%. The downward slide, uninterrupted since the 2008 financial crisis, has been further aggravated by the pandemic era’s protectionist surge and the drive toward supply-chain insulation.
The global composition of FDI has also shifted:
- Europe’s share of global outward FDI has shrunk from its long-term average of 39% (2000–2019) to 21% in 2021–2024.
- The United States has remained stable at about 19–20%.
- China’s role has grown dramatically, climbing to nearly 11% of global outward FDI in the post-pandemic period, up from negligible levels two decades ago.
The China+1 diversification trend has fuelled strong inflows into Vietnam, Mexico, Indonesia, Brazil, and several African economies. Africa’s share of global net FDI almost doubled from 2.8% to 4.7% in the post-pandemic years.
India, however, saw its global FDI share ease from 2.9% to 2.4%, primarily due to larger repatriation volumes.
FDI in India: Gross Inflows Up, Net Inflows Under Pressure
Gross FDI inflows rebounded to USD 81 billion in FY25, a 13% rise after two nearly flat years. But this positive movement was overshadowed by unusually high outflows:
- Profit repatriation averaged USD 48 billion in FY24–FY25
- FDI outflows from India averaged USD 22 billion in the same period
Both categories surged—69% and 58% higher, respectively, than their FY21–FY23 averages. This resulted in net FDI sliding to USD 10 billion in FY24 and USD 1 billion in FY25.
UNCTAD’s 2024 updates highlighted notable divestments including:
- Disney’s partial exit, merging Star India into Viacom18 in a USD 3 billion deal
- Novartis’ sale of a major stake in its India operations
Yet momentum improved in H1 FY26:
- Gross FDI rose 16% YoY to USD 50 billion
- Profit repatriation dropped 5% YoY
- Outflows moderated significantly
Net FDI inflows recovered to USD 7.6 billion in the first half of FY26.
Where the Money Comes From: Country Trends
India’s traditional FDI contributors remain stable:
- Singapore – 30% (FY25)
- Mauritius – 17%
- United States – 11%
- Netherlands – 9%
- UAE – 9%
- Japan – 5%
But the composition is changing. Compared with FY16–FY19:
- U.S. share rose from 7% to 13%
- UAE from 2.1% to 6.1%
- Netherlands from 7.4% to 8.4%
- Japan’s share fell from 7% to 4.6%
Sectoral View: Services Lead, Digital and Renewable Spaces Accelerate
The services sector regained the top spot in FY25:
Sector | FY25 Share | Growth (YoY) |
|---|---|---|
Services | 19% | +41% |
Computer Software & Hardware | 16% | -2% |
Trading | 8% | +8% |
Non-Conventional Energy | 8% | +7% |
Services FDI jumped to USD 9.4 billion from USD 6.6 billion the previous year.
UNCTAD data also points to a significant rise in greenfield manufacturing investments—notably in semiconductors, electronics, EV components, metals—and strong growth in digital infrastructure, including cloud and data centre projects.
State Leaders: Maharashtra Dominates
FDI equity inflows by state in FY25:
- Maharashtra – 39%
- Karnataka – 13%
- Gujarat – 11%
- Tamil Nadu – 7%
- Haryana – 6%
- Telangana – 6%
Maharashtra, Haryana, and Tamil Nadu delivered the strongest YoY growth.
India’s Outbound FDI Surges
India is not only receiving capital—it is increasingly exporting it.
Outbound FDI averaged USD 20 billion in FY23–FY25, up from USD 8 billion in FY15–FY19.
UNCTAD’s World Investment Report 2025 ranks India among the world’s top 10 global investors, driven by:
- A 20% rise in Indian greenfield project announcements
- Strong interest across Europe, South America, and Africa
- Major investments in telecom, ports, mining, EVs, energy, pharma, steel, and defence
In FY25, outbound investment into manufacturing and services each more than doubled (118% YoY), reaching USD 6.6 billion and USD 18.6 billion, respectively.
India’s FDI Returns: High, Stable, and Globally Attractive
CareEdge’s analysis of inward FDI returns—defined as direct investment income divided by FDI stock (with a two-year lag)—shows India remains one of the most attractive destinations.
India’s average 10-year return: 7.3%
This is higher than Australia, South Africa, Mexico, France, Germany, and the United States.
While several emerging markets show higher nominal returns (Bangladesh, Nigeria, Malaysia), they also exhibit significantly greater volatility.
On a risk-adjusted basis, India ranks second only to Indonesia among major economies studied.
Looking Ahead: India’s FDI Opportunity
CareEdge concludes that although net inflows appear weak, India’s fundamentals remain highly favourable:
- Strong economic growth
- Policy continuity
- Fiscal discipline
- Deep domestic market
- Demographic strength
Emerging sectors such as semiconductors, EVs, battery storage, and digital infrastructure are expected to pull in substantial future FDI.
Continued reforms in regulatory frameworks, logistics, factor markets, and ease-of-doing-business will be crucial in converting India’s macro advantage into long-term FDI resilience.