Natural fibers or natural fibres are fibers that are produced by geological processes, or from the bodies of plants or animals. They can be used as a component of composite materials, where the orientation of fibers impacts the properties. Natural fibers can also be mat- ted into sheets to make paper or felt.
The earliest evidence of humans using fibers is the discovery of wool and dyed flax fibers found in a pre- historic cave in the Republic of Georgia that date back to 36,000 BP. Natural fibers can be used for high-tech applications, such as composite parts for automobiles. Compared to composites reinforced with glass fibers, composites with natural fibers have advantages such as lower density, better thermal insulation, and reduced skin irritation. Further, unlike glass fibers, natural fibers can be broken down by bacteria once they are no longer in use.
Natural fibers are good sweat absorbents and can be found in a variety of textures. Cotton fibers made from the cotton plant, for example, produce fabrics that are light in weight, soft in texture, and which can be made in various sizes and colors. Clothes made of natural fibers such as cotton are often preferred over clothing made of synthetic fibers by people living in hot and humid climates.
| India – NATURAL FIBRE IMPORT | |||
| Commodity | Apr-Mar 2021 (R) | Apr-Mar 2022 (F) | %Growth |
| Silk | 99.26 | 147.96 | 49.06 |
| Wool, fine or coarse animal hair, horse- hair yarn and woven fabric. | 164.53 | 279.54 | 69.89 |
| Cotton | 509.5 | 738.99 | 45.04 |
| Other vegetable textile fibres; paper yarn and woven fab- rics of paper yarn. | 250.94 | 420.29 | 67.49 |
Source: Ministry of Commerce and Industry
Natural fibre has different types of products like ma- chines for processing silk, wool, fine or coarse animal hair, horsehair yarn and woven fabric, cotton, as well other vegetable textile fibres; paper yarn and woven fabrics of paper yarn. All these products totally in the year 2021 has a turnover of US$1024.23 million whereas in 2022 it went up till US$1586.78 million and the growth is 57.87%.
Silk
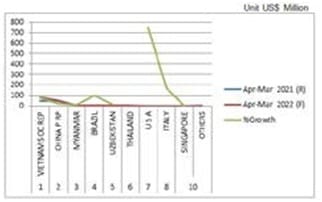
Silk has a very high growth percentage in almost all countries. Silk had a highest growth in Vietnam in 2020 that was at US$ 46.71million in 2021 whereas in 2022 it went upto US$82.3 million i.e. 76.2%; in China PRP it was at US$ 43.35 million whereas in 2022 it went upto US$52.31 million i.e. 20.68%; in Myanmar it was at US$ 3.53% in 2021 whereas in 2022 it went upto US$3.79 million i.e. US$7.65%; in Brazil it was at US$ 1.46 million whereas in 2022 it went upto i.e. US$ 2.93 million i.e. US$ 101%; in Uzbekistan it was at US$1.99 million whereas in 2022 it went upto US$2.35 million i.e. 18.07%; in Thailand it was at till US$ 0 million in 2021 it went upto US$ 1.8million i.e. 0%; in U S A it was at US$ 0.07 million in 2021 while in 2022 it went upto US$ 0.61million i.e 747.77%; in Italy it was at US$ 0.16 million in 2021 while in 2022 it went upto US$ 0.43 million i.e 170.44%; in Singapore it was at US$ 0.25 million in 2021 while in 2022 it went upto US$ 0.26 million i.e 4.87%; in Others it was at US$ 1.74 million in 2021 while in 2022 it went upto US$ 0.73 million i.e 0 %.
| S.No. | Country | Apr-Mar 2021 (R) | Apr-Mar 2022 (F) | %Growth |
| 1 | VIETNAM SOC REP | 46.71 | 82.3 | 76.2 |
| 2 | CHINA P RP | 43.35 | 52.31 | 20.68 |
| 3 | MYANMAR | 3.53 | 3.79 | 7.65 |
| 4 | BRAZIL | 1.46 | 2.93 | 101 |
| 5 | UZBEKISTAN | 1.99 | 2.35 | 18.07 |
| 6 | THAILAND | 1.8 | ||
| 7 | U S A | 0.07 | 0.61 | 747.77 |
| 8 | ITALY | 0.16 | 0.43 | 170.44 |
| 10 | SINGAPORE | 0.25 | 0.26 | 4.87 |
| OTHERS | 1.74 | 0.73 | ||
| TOTAL | 99.26 | 147.51 |
Wool, fine or coarse animal hair, horsehair yarn and woven fabric
Wool, Animal hair, horsehair yarn & fabric are on high demand as the winter season is going on so the busi- ness is at a peak. In Australia it was at US$ 54.44mil- lion in 2021 and it went upto US$108.62million i.e. 99.52%; in China PRP it was at US$22.34million in 2021 whereas in 2022 it went upto US$43.69million i.e. US$95.55 million; in New Zealand in 2021 it was at US$ 25.39million and in 2022 it went upto US$37.21mil- lion i.e. 46.53%; in Syria it was at US$ 11.83million in 2020 while in 2022 it went upto US$13.09million i.e 10.67%; in South Africa in 2021 it was at US$3.47mil- lion whereas in 2022 it went it went upto US$11.42mil- lion i.e. 228.97%; in Turkey it was at US$7.54million in 2021 while in 2022 it went upto US$10.64million i.e. 41.23%; in Italy it was at US$ 6.57million in 2021 while in 2022 it went upto US$ 8.84million i.e 34.52%; in U K it was at US$ 4.93million in 2021 while in 2022 it went upto US$ 6.78million i.e 37.55%; in Netherland it was at US$ 1.59million in 2021 while in 2022 it went upto US$ 3.s28million i.e 106.66%; in Others it was at US$ 23.53million in 2021 while in 2022 it went upto US$ 31.36million i.e 0 %.
| S.No. | Country | Apr-Mar 2021 (R) | Apr-Mar 2022 (F) | %Growth |
| 1 | AUSTRALIA | 54.44 | 108.62 | 99.52 |
| 2 | CHINA P RP | 22.34 | 43.69 | 95.55 |
| 3 | NEW ZEA- LAND | 25.39 | 37.21 | 46.53 |
| 4 | SYRIA | 11.83 | 13.09 | 10.67 |
| 5 | SOUTH AF- RICA | 3.47 | 11.42 | 228.97 |
| 6 | TURKEY | 7.54 | 10.64 | 41.23 |
| 7 | ITALY | 6.57 | 8.84 | 34.52 |
| 8 | U K | 4.93 | 6.78 | 37.55 |
| 10 | NETHER- LAND | 1.59 | 3.28 | 106.66 |
| OTHERS | 23.53 | 31.36 | ||
| TOTAL | 161.63 | 274.93 |
Source: Ministry of Commerce and Industry
Cotton
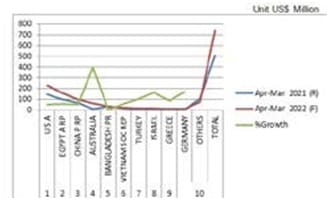
Cotton prices are growing day by day and it is a very highly growing industry in textile. In USA cotton was at US$ 149.63million in 2021 and in 2022 it grew upto US$229.86million i.e. 53.62%; in EGYPT A RP it was at US$99.56 million whereas in 2022 it grew upto US$156.11million i.e. 56.79%; in China P RP it was at US$ 67.95million in 2021 and in 2022 it grew upto US$101.52million i.e. 49.41%; in Australia it was at US$ 13.34million in 2021 while in 2022 it grew upto US$66.42million i.e 397.92%; in Bangladesh PR in 2021 it was at US$34.54million whereas in 2022 it grew upto US$37.13million i.e. 7.5%; in Vietnam Soc Rep it was at US$14.22million in 2021 while in 2022 it grew upto US$22.74million i.e. 59.86%; in Turkey it was at US$ 7.46million in 2021 while in 2022 it grew upto US$ 15.15million i.e 103.02%; in Greece it was at US$ 6.57million in 2021 while in 2022 it grew upto US$ 12.33million i.e 87.81%; in Germany it was at US$ 3.78million in 2021 while in 2022 it grew upto US$ 10.26million i.e 171.7%; in Others it was at US$ 107.02million in 2021 while in 2022 it grew upto US$ 73.31million i.e 0 %.
| S.No. | Country | Apr-Mar 2021 (R) | Apr-Mar 2022 (F) | %Growth |
| 1 | U S A | 149.63 | 229.86 | 53.62 |
| 2 | EGYPT A RP | 99.56 | 156.11 | 56.79 |
| 3 | CHINA P RP | 67.95 | 101.52 | 49.41 |
| 4 | AUSTRALIA | 13.34 | 66.42 | 397.92 |
| 5 | BANGLA- DESH PR | 34.54 | 37.13 | 7.5 |
| 6 | VIETNAM SOC REP | 14.22 | 22.74 | 59.86 |
| 7 | TURKEY | 7.46 | 15.15 | 103.02 |
| 8 | ISRAEL | 5.37 | 14.09 | 162.33 |
| 9 | GREECE | 6.57 | 12.33 | 87.81 |
| 10 | GERMANY | 3.78 | 10.26 | 171.7 |
| OTHERS | 107.02 | 73.31 | ||
| TOTAL | 509.44 | 738.92 |
Other Vegetable textile fibres; paper yarn and woven fabrics of paper yarn
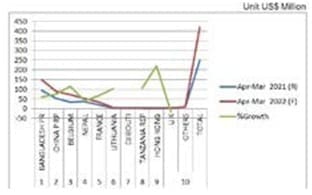
Vegetable textile fibres; paper yarn and woven fabrics of paper yarn has a growth which is quite fluctuating in ev- ery country. In Bangladesh PR it was at US$ 93.45million in 2021 and in 2022 it grew upto US$149.08million i.e. 59.53%; in China P RP it was at US$ 51.9million in 2021 whereas in 2022 it grew upto US$90.08million i.e. 73.55% ; in Belgium was at US$33.67 million in 2021 and in 2022 it grew upto US$ 72.41million i.e. 115.06%; in Nepal it was at US$ 36.86million in 2021 while in 2022 it grew upto US$52million i.e 41.07% ; in France it was at 2021 it was at US$19.65million whereas in 2022 it grew upto US$32.76million i.e. 66.7%; in Lithuania it was at US$2. 03million in 2021 while in 2022 it grew upto by US$4. 11million i.e. 103.06%; in Turkey it was at US$ 7.46million in 2021 while in 2022 it grew upto by US$ 15.15million i.e 103.02%; in Djibouti it was at US$ 7.46million in 2021 while in 2022 it is declined by US$ 0million i.e 0%; in Tanzania Rep it was at US$ 1.12million in 2021 while in 2022 it grew upto US$ 2.32million i.e 106.2%; in Hong Kong it was at US$ 0.726million in 2021 while in 2022 it grew upto US$ 2.31million i.e 221.67%; in U K it was at US$ 2.66million in 2021 while in 2022 it grew upto US$ 2.23million i.e 15.83%; in Others it was at US$ 8.87mil- lion in 2021 while in 2022 it grew upto US$ 10.1million i.e 0 %.
| S.No. | Country | Apr-Mar 2021 (R) | Apr-Mar 2022 (F) | %Growth |
| 1 | BANGLADESH PR | 93.45 | 149.08 | 59.53 |
| 2 | CHINA P RP | 51.9 | 90.08 | 73.55 |
| 3 | BELGIUM | 33.67 | 72.41 | 115.06 |
| 4 | NEPAL | 36.86 | 52 | 41.07 |
| 5 | FRANCE | 19.65 | 32.76 | 66.7 |
| 6 | LITHUANIA | 2.03 | 4.11 | 103.06 |
| 7 | DJIBOUTI | 2.86 | ||
| 8 | TANZANIA REP | 1.12 | 2.32 | 106.2 |
| 9 | HONG KONG | 0.72 | 2.31 | 221.67 |
| 10 | U K | 2.66 | 2.23 | -15.83 |
| OTHERS | 8.87 | 10.1 | ||
| TOTAL | 250.93 | 420.26 |