Synopsis
- India’s coal production reached a new milestone of 524 Million Tonne (MT) during YTD FY23 (April- November 2022), a 17.1% y-o-y growth, driven by 16.8% y-o-y increase in production by Coal India Limited (CIL). The power sector continued to be the largest consumer of domestic coal, accounting for 85% of the total despatches of 588 MT during YTD
- Total coal imports surged by 25.7% y-o-y to 154.7 MT during April-October 2022, despite high imported coal prices led by high demand for non-coking coal from the power
- International coal prices of major global benchmarks remained elevated in November 2022, due to ongoing geopolitical
- Ministry of Coal has concluded five tranches of commercial coal mines auction under the “Coal Mines (Special Provisions) Act 2015 and Mines & Minerals (Development & Regulation) Act 1957” and 64 coal mines have been allocated till date. Further, the sixth tranche of the commercial coal mines auction was launched in November 2022, where 141 coal mines have been
- “CareEdge Research expects coal production to touch 850–900 MT by end of this fiscal, with further upside potential in the medium-term. This is likely to be driven by CIL’s expected ramp-up in production to achieve the Ministry of Coal’s target to produce 1.3 billion tonne by FY25 and 1.5 billion tonne by FY30. The production will further be supported by the gradual commissioning of the captive and commercial coal mines auctioned by the Government. Despatches to the power sector are likely to inch up further as demand from coal-based power plants remains high to meet the country’s rising energy requirements,” Tanvi Shah, Director, CareEdge Advisory & Research,
Production Crossed 500 MT as of November 2022
Domestic coal production crossed 524 million tonne (MT) during YTD FY23 (April–November), registering 17.1% y-o-y growth over the same period in FY22. CIL continued to be the largest producer of coal accounting for 79% of the total production during YTD FY23. CIL’s production grew by 16.8% y-o-y during this period.
Coal production from captive mines increased by 33.4% y-o-y in YTD FY23 and contributed 13.6% to the total coal production during this period, vs. 11.9% during the same period in FY22. This growth was led by Government’s support for coal production from existing operational captive coal mines. The increased contribution by captive mines was also supported by three new captive coal mines that commenced production in FY23. The production from Singareni Collieries Company Limited remained flat y-o-y.
Chart 1: Coal Production (MT)
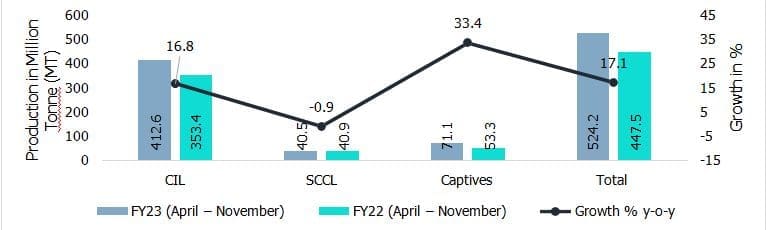
Sources: Ministry of Coal, CareEdge Research Note: CIL- Coal India Limited, SCCL- Singareni Collieries Company Limited
Coal Despatches to Power Sector Grew by 11.7% y-o-y
Total coal despatch during YTD FY23 increased by around 7.4% y-o-y, supported by higher production and improved rail connectivity for all major mines under PM Gati Shakti – National Master Plan for Multi-modal Connectivity, which is targeted towards faster and efficient transportation of coal. The aggregate coal despatch to the power sector and captive power plants (CPP) combined during this period was more than 500 MT, an increase of 10% y-o-y. These sectors contributed 90% of the total coal despatches during YTD FY23 as against 88% during same period in FY22.
Chart 2: Coal Despatch (MT)
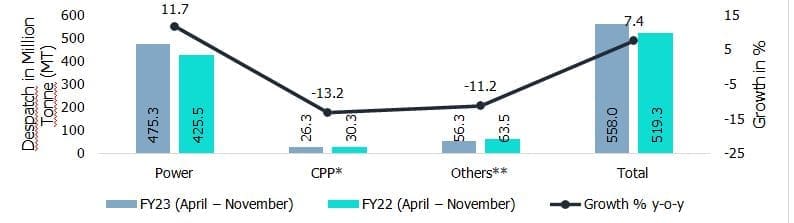
Source: Ministry of Coal, CareEdge Research
*CPP- Captive power plants. **Others – cement, steel, sponge iron, fertilizers, textiles, chemicals, paper & pulp, and other basic metals
Overall, rakes available to the power sector during YTD FY23 increased by 9.4% y-o-y. As of November 2022, rakes supply has seen an uptick post the decline in Q2FY23 amidst monsoon season.
Table 1: CIL’s Rake Supply towards Power Sector (Average Number of Rakes Per Day)
| Average Loading in | FY23 | FY22 | Growth % (FY23 vs. FY22) |
| April | 261 | 243 | 7.2 |
| May | 274 | 245 | 12.1 |
| June | 278 | 222 | 25.2 |
| July | 248 | 211 | 17.9 |
| August | 233 | 211 | 10.3 |
| September | 232 | 221 | 5.0 |
| October | 238 | 255 | -6.7 |
| November | 266 | 248 | 7.2 |
Sources: Ministry of Coal, CareEdge Research; Note: Data are Provisional
Energy Requirement and Plant Load Factor for Coal-based power Plants
The overall energy requirement in the country has increased from 920,587 MU during YTD FY22 to 10,17,940 MU during YTD FY23. Coal-based power generation has accounted for more than 65% of total power generated in the past years. As of 30th November 2022, the PLF1 of coal-based power plants improved to 61.5% from 53.5% as of November 2021, primarily due to a ramp-up in domestic coal supply to meet the high demand for coal-based power plants.
Chart 3: Plant Load Factor (Coal-based power plants)
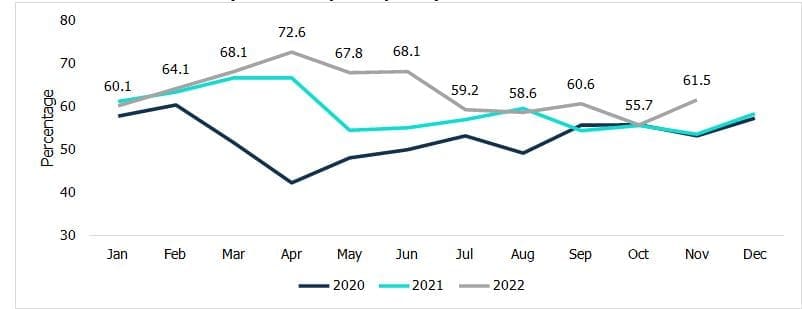
Source: Central Electricity Authority (CEA), CMIE, CareEdge Research, Data is provisional
As of December 17, 2022, the coal stock at non-pithead power plants has improved to nearly 11 days from around 7 days in April 2022. As per CEA, pithead power plants have around 97% of their normative stock available as of November 30, 2022, while non-pithead plants2 have only around 47% of their normative stock available.
Coal Imports
During April-October 2022 period in current fiscal, coal imports increased despite the surge in international coal prices peaking in the month of October. Non-coking coal continued to drive India’s coal imports and accounted for more than 65% of total coal imports. Coal traders and power sectors are the major importers of non-coking coal.
Table 2: Total Coal Imports
| Type of Coal | April-October | Growth (%) Y-o-Y | |
| FY23 | FY22 | ||
| Non-Coking | 104.4 | 79.5 | 31.3 |
| Coking | 32.7 | 30.5 | 7.3 |
| Others* | 17.6 | 13.1 | 34.6 |
| Total | 154.7 | 123.1 | 25.7 |
Sources: Ministry of Coal, CareEdge Research
Note: * indicates that others include Anthracite, PCI Coal, Pet Coal, Met Coke
International Coal Prices
Global coal prices have been on an upward trajectory since November 2021 due to the geopolitical tensions between Russia and Ukraine which have caused significant price fluctuations since the beginning of this fiscal. For the quarter ending September 2022, the Australian, Indonesian and South African coal prices surged by a staggering 144%, 142% and 139% y-o-y respectively. Coal prices of these global benchmarks remained elevated in October and
1 PLF or capacity utilisation is the proportion of electricity generated compared to overall installed capacity
2 Non-pit head plants are power plants where the coal mines are more than 1,500 km away
November 2022. In FY23, coal prices are expected to remain elevated owing to ongoing geopolitical tensions and global inflationary pressures.
Chart 4: International Coal Prices (USD/tonne)
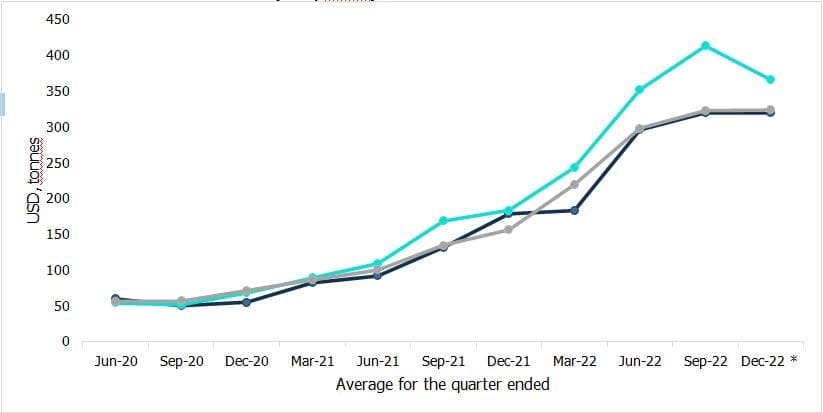
Source: World Bank, CMIE, CareEdge Research
Note: * indicates that data for Dec-22 is average of Oct-22 and Nov-22